Peter Smith

⬤Solana is trading in a tightening structure just below a key resistance zone, with price compressing between horizontal resistance and rising support. SOL continues to face repeated rejection in the $92-$95 area while maintaining its structure without any meaningful breakdown.
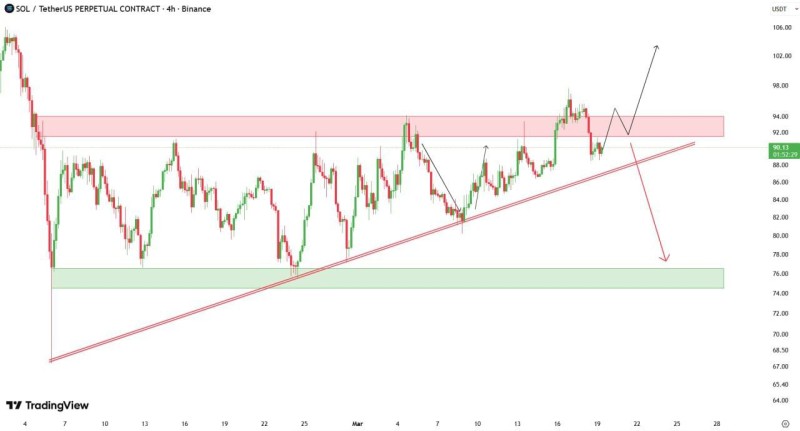
⬤The chart shows multiple rejections from the $92-$95 resistance band, confirming it as a strong supply zone. At the same time, SOL is forming higher lows along an ascending trendline, meaning buyers are stepping in earlier on each pullback. Solana forms bottom structure near $93, and this kind of setup reflects building pressure beneath resistance rather than weakness.
⬤The current formation resembles a classic squeeze pattern. A confirmed breakout above $95 could trigger a fast move toward the $100-$105 region. Conversely, if the ascending trendline fails, downside targets point toward the $78-$75 demand zone. Solana exits downtrend and targets $95-$100 after holding $77 support, with the broader range between $77 and $94 showing higher lows that signal increasing buyer strength.
⬤The importance of this setup lies in its positioning at a key inflection point. Solana is compressed into a decision zone, and such conditions often precede strong directional moves. The resolution of the squeeze will likely determine short-term momentum and volatility across the broader market.
⬤Recent technical coverage reinforces this view. Solana tests key resistance near $95 after 25% rebound, with multiple analysts highlighting the same consolidation behavior around the same resistance zone as a defining setup for the weeks ahead.
 Peter Smith