 Usman Salis
Solana (SOL) recent recovery has caught traders' attention, but the latest chart formation suggests caution may be warranted. While SOL has bounced from the $200 zone, the current move appears more corrective than impulsive. A well-defined Bearish Gartley pattern is developing on the 4-hour chart, which could limit upside momentum unless bulls push through critical resistance levels.
Solana Shows Corrective Bounce Toward Key Resistance
On the 4H chart, Solana is advancing toward a harmonic completion zone. Crypto analyst Safu pointed out that the bounce lacks strong impulsive volume, increasing the risk of rejection at this zone and a potential pullback toward liquidity support.
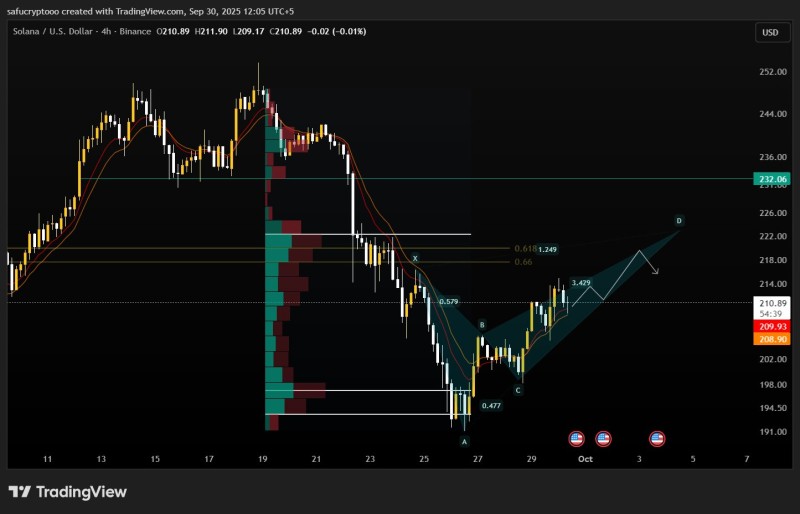
The current trajectory places the completion of the Gartley pattern in the $222–$224 range, where Fibonacci retracement levels and previous supply converge.
Chart Analysis: Bearish Gartley Setup
The Gartley harmonic pattern suggests potential exhaustion around $222–$224, which aligns with Fibonacci levels (0.618–0.66 retracement of the prior decline). SOL currently trades near $210, moving inside a rising wedge. The volume profile shows reduced buying activity compared to earlier moves, underlining the corrective tone.
Key levels to watch include: bearish zone at $222–$224 (pattern completion), bullish breakout level at $232 (which would invalidate the Gartley and flip momentum bullish), first support at $205, and deeper support near $198.
Why This Matters
The Bearish Gartley is a high-probability reversal signal when confirmed by confluence levels. The $205 support and $232 breakout level are critical areas where liquidity is concentrated. Solana's strong rally earlier in September has left the market prone to corrective setups, which are now playing out technically.
Bulls or Bears at $232
Solana's immediate future depends on whether it can break cleanly above $232. A rejection at $222–$224 would likely confirm the Bearish Gartley and send SOL back to $205 liquidity. However, a decisive breakout above $232 would invalidate the bearish pattern, opening the way for further upside toward $236 and beyond. For now, the chart suggests a cautiously bullish short-term move, but bears may take control if the $222–$224 resistance holds.
 Usman Salis


