Usman Salis
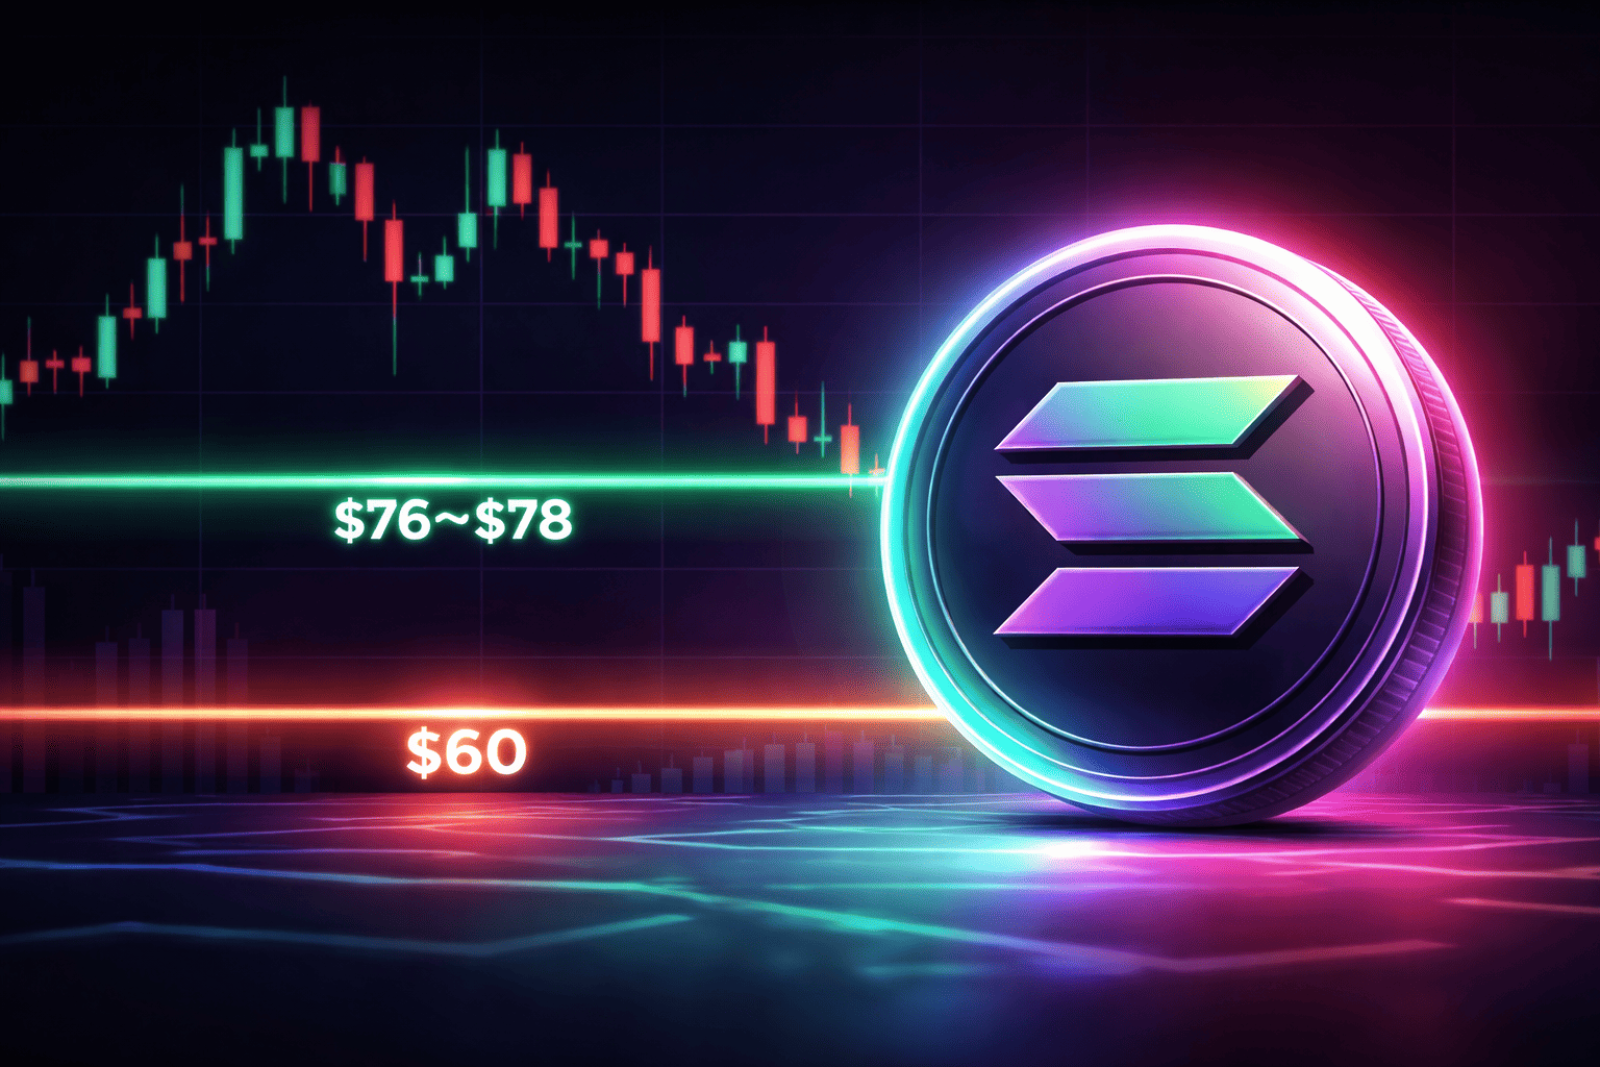
⬤ Solana is hovering under $80 and pressing into a key local support area after a recent pullback from the low $90s. The 4-hour SOL/USDT chart shows price near $78.89, sitting inside a marked demand zone that has absorbed multiple selloffs over the past several sessions.
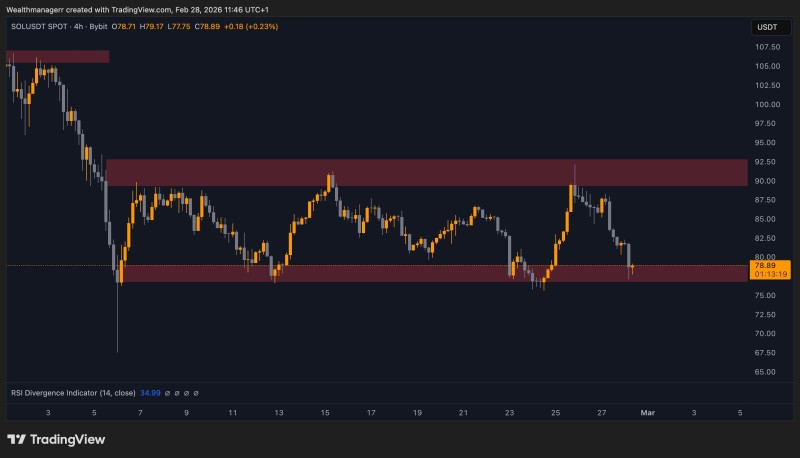
⬤ The chart also highlights a clear ceiling near $90-$92, where rallies have repeatedly been rejected, reinforcing a defined range between resistance and the $76-$78 floor. After a sharp bounce from support earlier in the month, Solana rotated back toward the upper band, then reversed and returned to the same base. This back-and-forth action makes the area increasingly important because repeated tests can weaken support if buyers fail to push price away decisively. The RSI reading near the mid-30s shows momentum is currently soft while price re-tests the lower boundary.
⬤ The scenario is straightforward: if SOL breaks beneath $76-$78, the chart implies less structural support immediately below, raising the odds of a quicker continuation move. In that case, the $60-$70 region becomes a realistic downside destination. Recent coverage has tracked similar behavior, including SOL tests $76 Support Zone With Eyes on $85-$88 Bounce.
⬤ This setup matters because Solana is approaching a binary technical decision point that can rapidly shift short-term sentiment across the broader altcoin market. Holding the $76-$78 band would keep the current range structure intact, while a confirmed breakdown would place the $60-$70 zone in focus and likely increase volatility around any macro-driven market swings.
 Usman Salis