 Saad Ullah
⬤ Solana ran into serious resistance after testing a technical sweet spot where Fibonacci levels met a descending trendline. The price stalled exactly where it was supposed to—right at that confluence zone—before reversing hard. SOL couldn't hold its ground once it touched those levels, proving sellers were ready and waiting. The chart makes it pretty clear: momentum died the moment price reached that barrier.
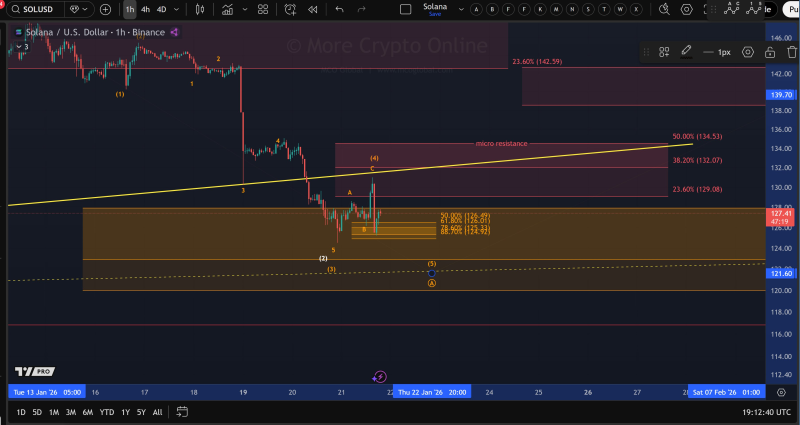
⬤ That rejection wasn't random. It happened right where multiple Fibonacci retracement levels lined up with a downward-sloping trendline, creating a resistance wall that was tough to break. The pullback came fast, and the overall structure suggests SOL's still stuck in consolidation mode rather than gearing up for a real breakout.
⬤ Now all eyes are on the downside. The $123 and $120 levels are the next spots to watch—both sitting on previous support areas and lower Fibonacci zones. There's a broader demand zone around these levels that could catch the falling knife if selling keeps up. How price reacts here will tell us whether we're looking at a bounce or another leg down.
⬤ This matters because Solana tends to move fast when it hits technical levels during volatile stretches. The clean rejection at resistance shows just how much weight these Fibonacci and trendline zones carry in the short term. What happens at $123 and $120 could set the tone for SOL's next move—whether it stabilizes here or keeps sliding.
 Saad Ullah


