Usman Salis

Solana (SOL) has quietly slipped back into one of the most significant price zones in its history. According to Crypto Patel, the level now holding SOL is the exact same buy zone that preceded a 2,194% rally — a data point that's hard to ignore regardless of where you stand on the current market.
The SOL Buy Zone That Triggered a 2,194% Solana Move
The chart Crypto Patel shared marks a clearly defined support and accumulation zone — the region where SOL previously spent time consolidating before launching into one of its most explosive moves on record. That 2,194% rally didn't come out of nowhere. It started right here, in this same area where price is now sitting again.
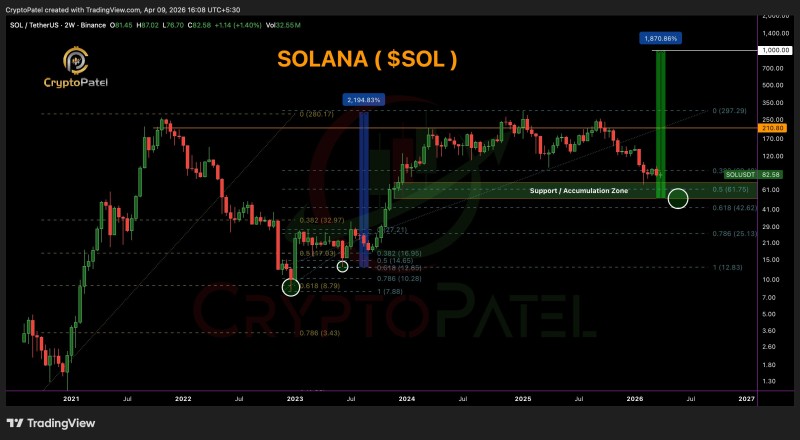
What makes this relevant isn't nostalgia — it's structure. Markets frequently return to levels where major moves originated, and those revisits tend to draw significant attention from both retail and institutional participants. The zone is acting as a decision point, just as it did before.
Price is sitting inside the same accumulation zone that previously acted as a springboard for one of SOL's strongest historical rallies.
Solana Price Structure Points to a Key Decision Level
There's no confirmed reversal on the chart — and that's worth stating clearly. What the setup does show is location. SOL is parked inside a historically meaningful zone, and that alone changes how traders approach the current price action.
Solana Returns to Key Support Zone as Markets Eye Next Move has covered how pullbacks into critical areas can define the next directional move. The pattern is familiar: price retraces, tests a major level, and either holds to form a higher low or breaks down entirely.
This current setup fits that framework. The accumulation zone is established, the retest is live, and the outcome remains open.
The only confirmed element at this stage is that price has returned to the same buy zone — what happens next is still being written.
Can SOL Reach $1,000 in the Next Alt Season?
The tweet raises a straightforward but loaded question: can SOL hit $1,000 in a future alt season? The chart includes a projected move higher, but it's conditional — it only matters if the current zone holds and accumulation actually develops again.
SOL Tests Multi-Month Trendline With $50 Target Looming explored how repeated reactions at major support levels define whether structure holds or collapses. That same principle applies here. The $1,000 scenario isn't a prediction — it's a projection tied entirely to what happens at this level first.
Traders also got a glimpse of how these setups can play out in SOL Signals Rebound After TD Sequential Buy Setup, where price stabilization near support indicated slowing downside momentum before a potential recovery move.
The $1,000 projection is conditional — it depends entirely on whether accumulation forms again at this zone, not on the level itself.
SOL Is at a Critical Location — The Next Move Defines Everything
The key facts are simple:
- SOL has returned to the same buy zone that preceded a 2,194% rally
- The zone previously acted as a base for one of Solana's strongest historical moves
- No breakout has been confirmed — the setup is forming, not resolved
- The $1,000 target remains a conditional projection, not a guaranteed outcome
Solana is back at a level that mattered enormously in the past. Whether that history repeats, or whether this becomes just another failed retest, is the question every SOL trader is sitting with right now.
 Usman Salis