 Saad Ullah

⬤ Solana's been on a rough ride lately. The 4-hour chart tells the story pretty clearly—SOL took a sharp nosedive before settling into the $118–$121 range. What started as a decent uptrend completely flipped, turning into a prolonged downtrend that eventually dumped price straight into this support zone. Now things are getting interesting as SOL tries to find its footing here.
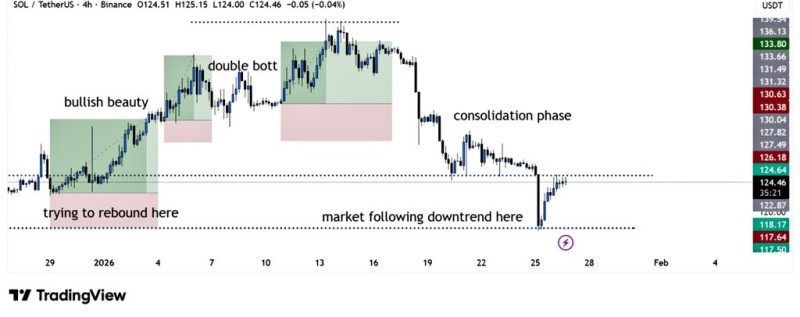
⬤ Not long ago, things looked pretty bullish. The chart showed SOL bouncing nicely with a double-bottom pattern and some strong upward moves. But that optimism didn't last. The price started making lower highs, and the momentum clearly shifted bearish. Once that happened, SOL followed the downtrend like clockwork before accelerating into the current demand zone.
⬤ The $118–$121 zone isn't random—it's where buyers have stepped in before. Right now, the price action looks like it's trying to build a base instead of falling further. If this consolidation sticks, the first real test comes at $126–$130, which lines up with previous resistance levels on the chart.
⬤ What happens next depends entirely on whether buyers can actually push back. If SOL holds above $118–$121 and starts climbing, $126–$130 is the first target, with $138–$145 in play if momentum really picks up. But if this support breaks, the downside opens up again, and the correction probably continues. This is basically a make-or-break moment for SOL's short-term direction.
 Saad Ullah


