 Saad Ullah

⬤ Solana's trying to find its footing after getting hit hard by sellers. The hourly chart shows price holding above recent lows and starting to recover. Right now, traders are watching what's labeled as wave (A) in the Elliott Wave pattern—basically a technical signal that suggests more upside could be coming as part of a bigger corrective bounce.
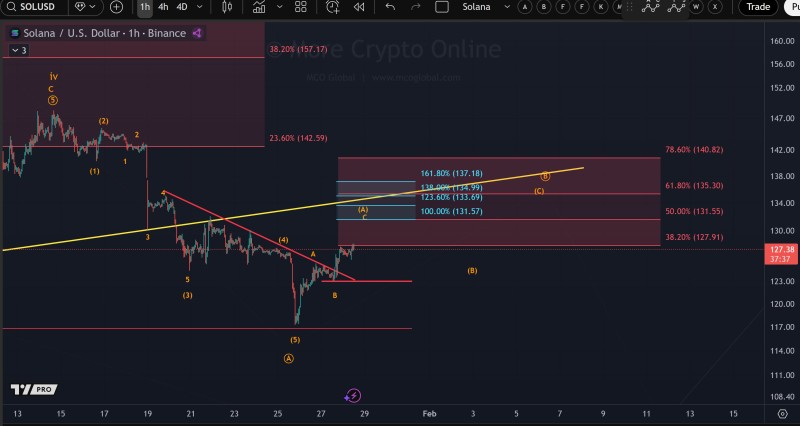
⬤ There's a clear resistance zone sitting above current price action where several Fibonacci levels bunch up between roughly $131 and $140. That's the potential upside range traders are eyeing for this recovery attempt. Price recently broke above a downward sloping trendline, which signals some short-term momentum is building. But it's still trading below that broader resistance area, so this looks more like a controlled bounce than a full trend reversal just yet.
⬤ Here's the make-or-break level: if SOL drops below the red support line at $123, the whole setup changes. That would mean wave (B) has already kicked in and the recovery move is done. This $123 level is basically the foundation holding the current rebound together. Stay above it, and the wave count stays valid. Break below it decisively, and we're likely looking at more downside ahead.
⬤ This technical setup matters because it gives traders a clear line in the sand for Solana's next move. The market's caught between that $131.57 recovery target on the upside and the $123 support threshold on the downside. How price handles this range will decide whether the corrective bounce continues higher or transitions into the next phase of the pattern—and that'll shape near-term momentum and where sentiment heads next.
 Saad Ullah


