Usman Salis
⬤ SEI is trading right at a critical spot around $0.105 on the 1-hour chart. Price has been slowly grinding down and now sits at what traders are calling both range support and a liquidity zone. The market's basically watching this level closely to see if sellers can push it lower or if buyers step in to defend it.
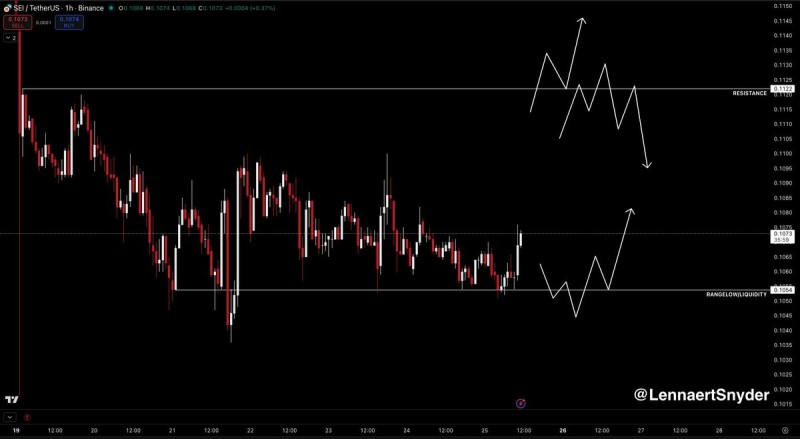
⬤ What's interesting is how price keeps bouncing off this lower boundary without actually crashing through it. Instead of a clean break, we're seeing price hold and consolidate tightly around support. This kind of action usually means the market hasn't made up its mind yet. If SEI dips just below $0.105 briefly and then recovers, that could signal the downside liquidity got absorbed without confirming a real breakdown.
⬤ That said, things could still go either way. If $0.105 fails to hold on higher timeframes, we'd likely see continued downside pressure and range expansion. There's also a clear resistance zone up around $0.112 where previous rallies got rejected. Breaking above that level would completely change the near-term outlook.
⬤ The real story here is that when price camps out at range extremes like this, volatility usually picks up soon after. How SEI handles the $0.105 area will probably determine where it heads next. A solid bounce could mean tests of resistance ahead, while losing support would confirm sellers are still in control. Either way, the next few sessions should give us answers.
 Usman Salis