 Usman Salis

⬤ SEI (SEIUSD) has jumped roughly 30% since a TD Sequential buy signal flashed on the daily chart, marking a solid comeback after weeks of downward pressure through October. The signal suggests a potential bullish reversal could be taking shape if the current momentum sticks around.
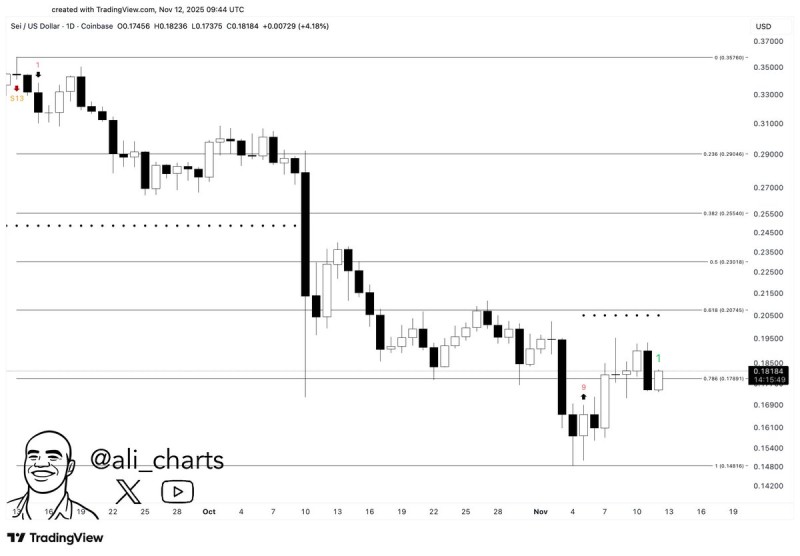
⬤ Right now, SEI is trading around $0.18 after holding support near $0.17. The chart shows key Fibonacci retracement levels with resistance zones at $0.21 and $0.23—the 0.618 and 0.5 retracement points. These levels are being watched closely as possible targets if buyers keep showing up.
⬤ The recent rally follows a sharp dip that pushed SEI below $0.16 earlier this month. The TD Sequential buy setup—which signals when a bearish trend may be running out of steam—triggered near that low and has since aligned with renewed bullish energy. If momentum confirms, market participants may be eyeing a move toward those mid-range resistance levels.
⬤ For traders, this could signal a short-term trend shift. Sustained closes above $0.21 would strengthen the bullish case and open the door toward the mid-$0.20 range. That said, if momentum fades, volatility could return quickly. Holding above the 0.786 Fibonacci zone around $0.178 will be key to keeping the bullish structure intact.
 Usman Salis


