Peter Smith
After weeks of sliding, SEI has arrived at a make-or-break moment. The token is now hovering around $0.15—a critical support zone that could determine whether it bounces back or breaks down further.
The Technical Setup
Technical analyst Ali recently flagged this exact level as the line in the sand. If SEI can hold here, the chart suggests a potential recovery path toward $0.23 first, and eventually up to $0.36, setting the stage for a multi-month rebound.
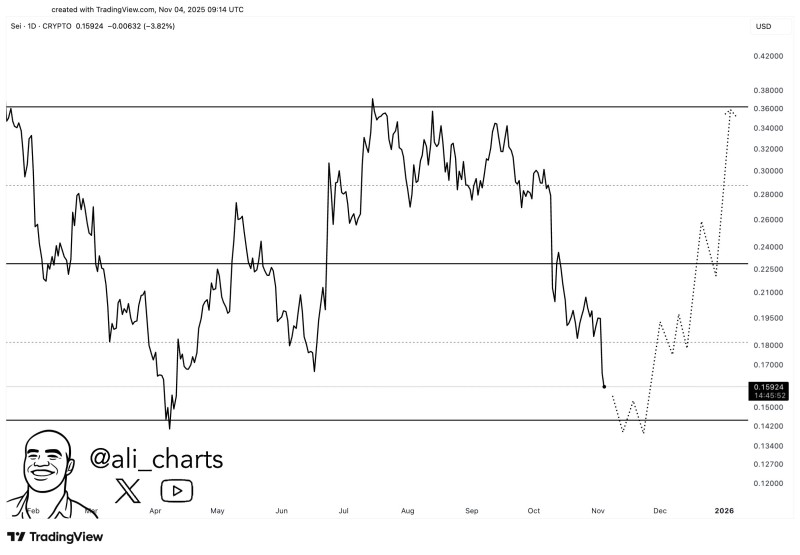
SEI has been in a steady downtrend since mid-September, giving back much of its summer gains. Now trading around $0.159, it's sitting right on top of major support at $0.15—a level that's acted as a price floor multiple times this year. Here's what the chart is showing:
- $0.15 support is the critical level to hold—if it breaks, SEI could slip toward $0.12–$0.13 where there's little cushion
- $0.23 resistance is the first upside target, matching an August consolidation zone
- $0.36 resistance is the bigger prize—SEI's last major peak before the September selloff
- Dotted projection on the chart maps out a gradual recovery starting now, climbing toward $0.23 in December and pushing toward $0.36 into early 2026
The downtrend is starting to lose steam, which often happens right before a base forms—especially if support holds for a few more sessions.
What's Driving the Outlook?
Beyond the chart, a few things could help SEI catch a bid. Bitcoin's been consolidating, and altcoins are starting to stabilize—good news for mid-caps like SEI. The project's also seen steady traction in DeFi and Web3 infrastructure, which adds some fundamental weight. That said, the broader crypto market is still volatile, and any macro shakeup could send SEI back to retest its lows.
 Peter Smith