Saad Ullah
⬤ SEI's chart is looking increasingly bullish. The price is squeezing into a tight symmetrical triangle after showing a bullish deviation below support. The diagonal resistance line has been tested multiple times, and traders are now watching closely for a possible breakout that could signal the start of a stronger move higher.
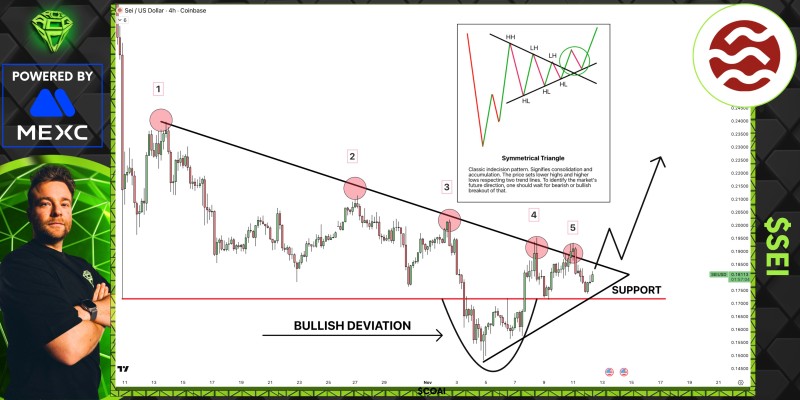
⬤ The 4-hour SEI/USD chart shows a clean symmetrical triangle that formed after a prolonged downtrend and recovery. The price has tested the descending resistance line at least five times while building higher lows along solid support near $0.17. This kind of compression usually means volatility is shrinking and buying pressure is building—often a setup for a decisive move.
⬤ If SEI breaks out cleanly, potential targets sit around $0.22–$0.24. But there's risk here too. A failed breakout or rejection at the upper boundary could trigger selling pressure, pushing SEI back to retest support at $0.17 or even slip toward $0.15. Volume confirmation and strong candle closes above resistance will be key before calling this a real breakout.
⬤ The repeated resistance tests suggest sellers are losing control, and the compression phase looks like classic market reaccumulation. For now, SEI traders are watching the triangle's apex closely. A clean break above that diagonal resistance would confirm the bullish reversal and potentially put SEI in line with other altcoins showing renewed strength.
 Saad Ullah