 Usman Salis
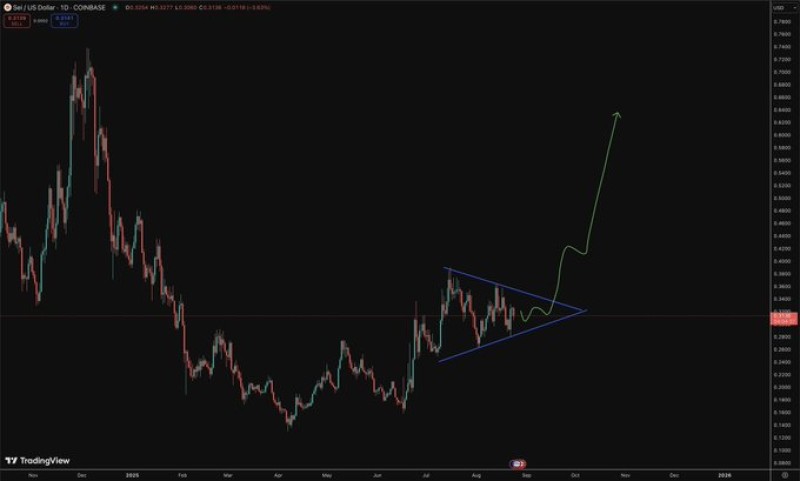
SEI is currently exhibiting one of the most reliable technical patterns in cryptocurrency trading. The token has formed a symmetrical triangle - a consolidation pattern that often precedes significant price movements. With buying pressure building and selling momentum weakening, market conditions appear favorable for an upside breakout.
SEI Price: Bulls Prepare for Explosive Breakout
SEI's chart displays a classic symmetrical triangle formation, historically one of the most reliable breakout setups in crypto markets. The price has been consolidating with decreasing volatility, creating mounting pressure that typically resolves with a strong directional move.
Market analyst @seiintern_ noted that buyers continue supporting higher lows while sellers struggle to push through upper resistance. This dynamic creates a bullish foundation, suggesting SEI is positioning for a significant rally once the triangle pattern completes.
SEI Price Targets: $0.55–$0.65 in Sight
Trading near $0.30, SEI approaches the triangle's apex where a breakout decision becomes imminent. Technical analysis projects potential targets of $0.55-$0.65 if bulls successfully break resistance with strong volume support - representing nearly 100% upside from current levels.
This pattern follows crypto's typical behavior: extended consolidation periods followed by rapid, powerful moves. A confirmed breakout could establish SEI among the quarter's top performers.
SEI Price Outlook: Risk/Reward Favors the Bulls
Multiple chart factors support the bullish scenario:
- Buyers consistently defend higher lows
- Selling pressure diminishes at resistance levels
- Volatility compression typically precedes sharp expansions
This "compression before expansion" dynamic creates favorable risk/reward for long positions. Traders can either establish early positions for maximum upside or await breakout confirmation above key resistance levels.
Conclusion: SEI Ready for Liftoff
SEI's technical setup suggests an imminent significant breakout. The combination of strong chart patterns, supportive trader sentiment, and clean symmetrical triangle formation indicates high probability for upward movement. Market participants should monitor volume closely as the pattern approaches its resolution point.
 Usman Salis


