 Usman Salis
SEI has faced downward pressure lately, but a bullish harmonic setup may signal a turning point. With price holding near $0.17–$0.19, the chart hints at a possible reversal that could spark an upside move.
SEI Chart Analysis: Harmonic Bullish Structure
Trader XD recently spotted a 1.902 deep crab pattern aligning with SEI's key support zone. The daily SEI/USD chart reveals a classic deep crab harmonic pattern completing around the 1.902 extension (approximately $0.17399). This overlap with historical support strengthens the case for a bullish reversal.
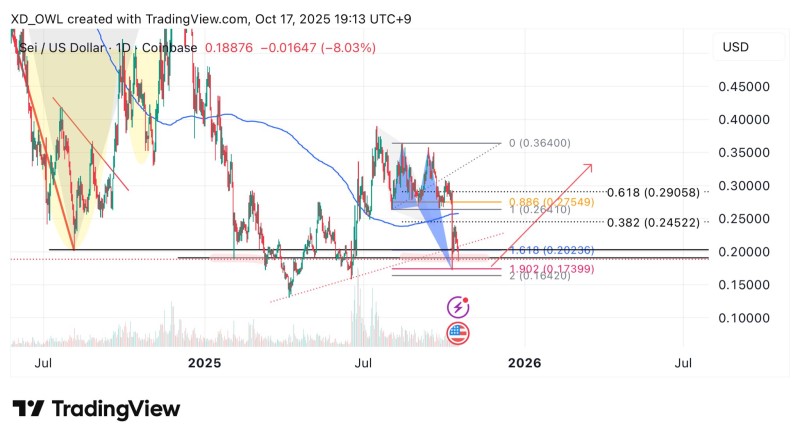
Key levels to watch:
- Support Zone: SEI is testing $0.17–$0.19, where the harmonic pattern completes and prior accumulation occurred. Holding here would be bullish.
- Immediate Resistance: The next barriers sit at $0.24 (Fib 0.382) and $0.26 (Fib 0.886). A break above these levels would confirm bullish momentum.
- Higher Resistance: If buyers take control, a move toward $0.29–$0.30 (Fib 0.618) becomes the next major target.
- Trend Context: SEI remains below its 200-day moving average, meaning a sustained breakout is needed to flip sentiment.
- Volume: Accumulation has picked up on recent dips, with increased activity as price neared the harmonic zone—a positive sign for bulls.
Market Context Supporting SEI
Beyond technical patterns, broader market factors will influence SEI's trajectory. If Bitcoin stabilizes, altcoins like SEI often benefit from capital rotation. Improving macro conditions—such as hints of easier monetary policy or calmer geopolitics—could lift risk assets. Additionally, SEI's growing role in DeFi and trading infrastructure may provide fundamental support for a technical bounce.
 Usman Salis


