 Peter Smith
The crypto market is heating up again, and SEI is emerging as one of the more interesting setups right now. Trading around $0.29, this token's chart is painting a picture that has traders paying close attention - the kind of pattern that could lead to serious gains if things play out right.
SEI Chart Signals a Bullish Structure
Trader Ali recently pointed out SEI's technical formation, and it's worth examining closely. The chart shows a textbook alignment with Fibonacci retracement levels and descending channel boundaries that map out where price might head next.
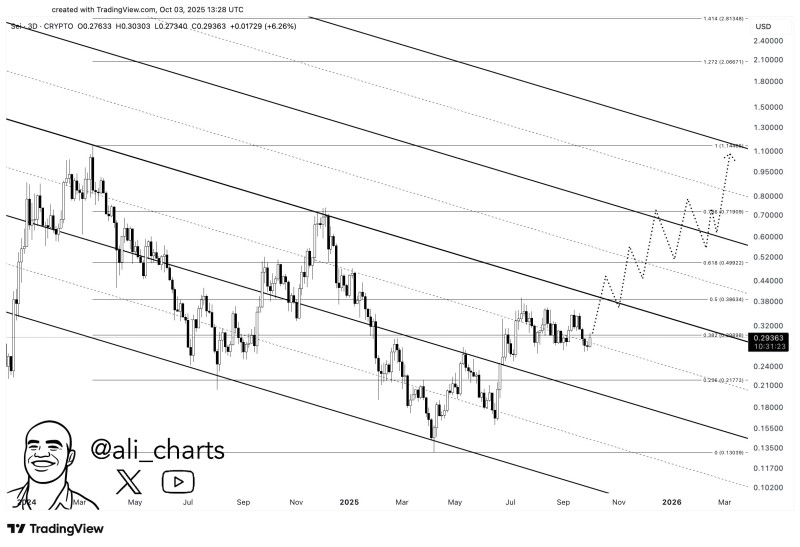
Right now, SEI is hanging around the 0.382 Fibonacci level near $0.29, which is acting as crucial support. Holding here keeps the bullish case alive, with upside targets sitting at $0.38, $0.52, and $0.71. Push through those, and we're looking at a potential run toward $1.15 - that's nearly a 200% move from current levels.
Key Technical Drivers
The bullish case rests on several factors: After an extended downtrend, SEI appears to be climbing out of a descending channel, showing early reversal signs. Multiple Fibonacci retracement levels are lining up with potential pivot zones, which traders often watch for turning points. The steady price action following previous weakness suggests accumulation might be underway, with investors quietly building positions ahead of a larger move. The $1.15 projection represents one of the most ambitious upside scenarios for SEI, reflecting strong bullish sentiment among technical analysts.
Broader Market Context
This setup isn't happening in isolation. The wider crypto market is showing signs of life, with Bitcoin holding firm near important levels and capital flowing back into altcoins. That creates a favorable environment for speculative plays like SEI. Add in softer inflation readings and the possibility of rate adjustments down the line, and you've got conditions that could really fuel altcoin momentum.
 Peter Smith


