 Peter Smith
SEI is currently consolidating within a bullish triangle formation, suggesting a possible upward move if buyers maintain control. The pattern shows growing market interest, with traders keeping a close eye on key support and resistance levels as volatility contracts.
SEI's Current Setup
The daily chart for SEI shows a textbook bullish triangle, with price action trapped between rising support around $0.28–$0.29 and falling resistance near $0.37. As noted by Sei Intern, the asset is "shaping up into a massive bull triangle," which typically indicates an accumulation phase before a breakout.
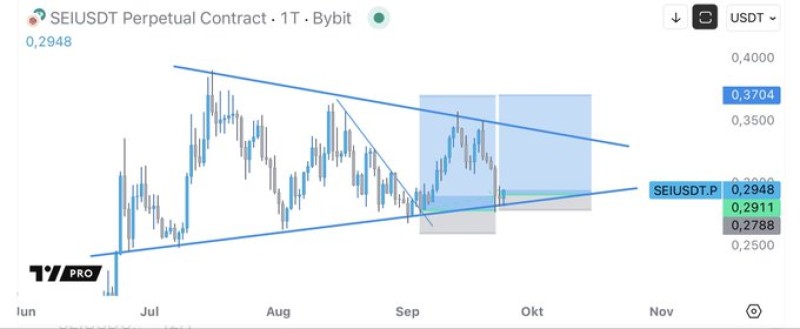
The tightening price range confirms we're in the compression stage that usually comes before a significant directional move.
Technical Levels Worth Watching
Support sits at $0.28–$0.29, matching the triangle's lower boundary. If price closes decisively below this zone, the bullish outlook would be off the table, and we'd likely see a retest of $0.25. Resistance is holding at $0.36–$0.37, marking the pattern's upper limit. A clean break above this level would probably spark momentum buying, with $0.40 as the next logical target. The long-term uptrend is still intact, backed by higher lows since June. Current consolidation suggests buyers are building positions rather than heading for the exits.
Market Context
The SEI ecosystem has been picking up steam lately, driven by increased interest in blockchain scaling solutions and growing developer adoption. With broader altcoin markets showing risk-on appetite, SEI appears well-positioned for a rally if the technical pieces fall into place.
 Peter Smith


