Usman Salis
SEI traders might have just caught a break. After sliding from highs above $0.35 down to $0.316, the hourly chart is flashing multiple TD Sequential buy signals, suggesting selling pressure may be exhausted and setting up a potential short-term bounce.
SEI Price Action: Support Holds Near $0.316
The 1-hour SEI chart shows a clear downward trend that brought the token from recent peaks down to the critical $0.316 support area. This level lines up perfectly with the 1.0 Fibonacci retracement, where buyers seem to be making their stand.
Looking at the current setup, support appears solid around $0.316–$0.318 where these fresh buy signals emerged. Trader Ali pointed out this setup, highlighting how the TD Sequential's "9" and "C13" buy signals have aligned – a combination that often signals trend exhaustion and hints at a potential reversal.
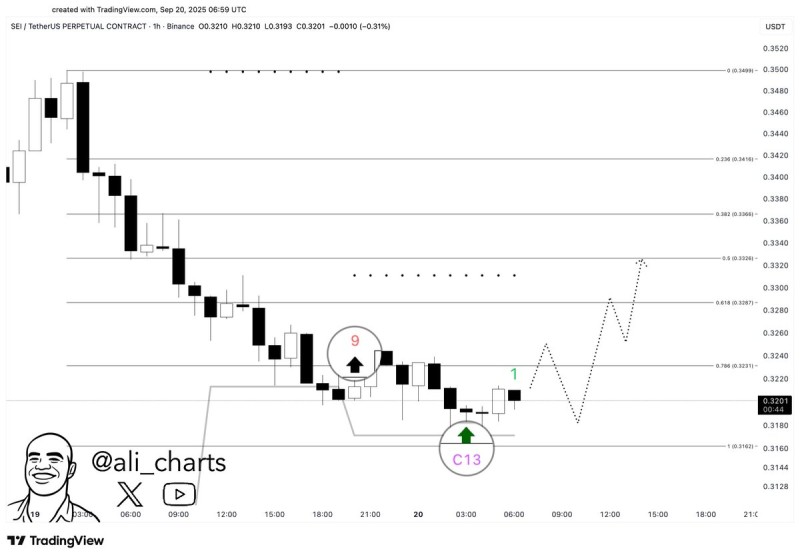
The immediate hurdle sits at $0.323–$0.328, which aligns with the 0.786 and 0.618 Fibonacci levels. If SEI can push through this resistance, the next targets would be $0.332 at the 0.5 Fib level, with a possible retest of the $0.34–$0.35 zone if momentum really picks up. The chart's dotted projection lines suggest a gradual recovery path, assuming the current support base holds firm.
Why SEI Could Bounce Back
SEI's recent weakness reflects broader altcoin profit-taking, but these buy signals suggest selling may have run its course. TD Sequential indicators typically appear at the end of sharp declines when momentum shifts. Bitcoin's stability above key levels has also given altcoins breathing room to recover, while SEI continues attracting speculative interest on exchanges.
What's Next for SEI
If SEI holds above $0.316, the bullish case targets $0.332–$0.34, with potential for a stronger breakout on increased volume. However, a decisive break below $0.316 would invalidate this setup and likely send SEI toward $0.31–$0.30. The key is whether buyers can build momentum from this support base.
 Usman Salis