Saad Ullah
SEI is sitting right on the edge of a cliff. After multiple failed attempts to push higher, this altcoin has dropped back to test its most important support zone around $0.26. What happens next could determine whether SEI bounces back toward its recent highs or tumbles into a much deeper correction. The technical picture suggests this wave b correction isn't done yet, but the buying pressure at these levels is real.
Technical Breakdown: Two Scenarios in Play
Analyst More Crypto Online has mapped out what's happening here, and it comes down to two possibilities for how this correction plays out:
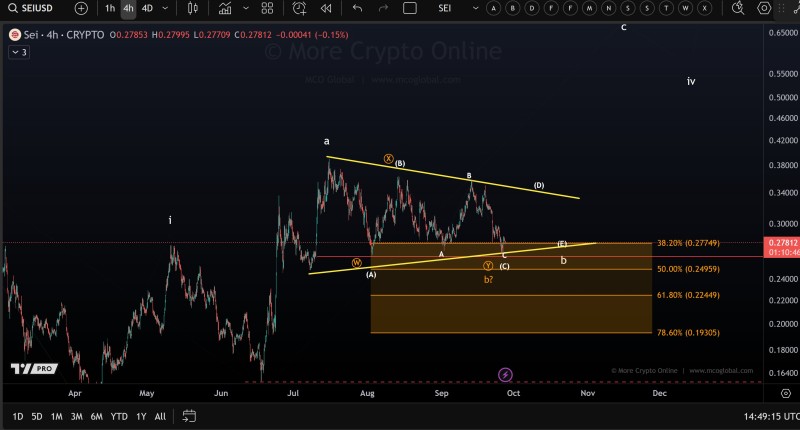
- Triangle scenario (white lines): SEI keeps bouncing between tighter support and resistance levels, building energy for an eventual breakout
- WXY scenario (orange lines): A more complex correction that could drag the price down to much deeper Fibonacci levels before finding a floor
The 4-hour chart shows SEI hovering right in that critical $0.277-$0.26 zone, which lines up perfectly with the 38.2% and 50% Fibonacci retracement levels. If it bounces from here, the triangle idea looks good. If it breaks down, we're probably looking at a slide toward $0.24 or even $0.19.
Why SEI's Next Move Matters
This isn't just another random altcoin fighting for survival. SEI has been making waves with its high-speed blockchain designed specifically for trading and DeFi applications. With the broader crypto market feeling cautious right now, how SEI handles this support test will say a lot about investor confidence. Hold here, and sentiment stays intact. Break down, and we could see a much longer period of weakness.
If the bulls step up: A solid defense of $0.26 could launch SEI back toward $0.34-$0.38, especially if the triangle scenario plays out with a clean breakout.
If support fails: A breakdown would likely extend this correction significantly, potentially pushing SEI down to the $0.22-$0.19 range before any meaningful recovery attempts.
SEI's battle for $0.26 support is the story right now. Whether this wave b correction wraps up as a triangle or drags out into a WXY pattern, traders should buckle up for more volatility ahead. The next few sessions will tell us if SEI can hold its ground or if deeper support levels are about to get tested.
 Saad Ullah