 Usman Salis
SEI traders are watching a critical level as the token presses against wedge resistance after months of compression. The chart suggests that a decisive breakout could double SEI's value in a short timeframe.
Chart Analysis: SEI at a Decision Point
The chart shows a classic descending wedge pattern, typically considered a bullish setup when broken to the upside. Sei Intern analysis reveals several key technical factors at play.
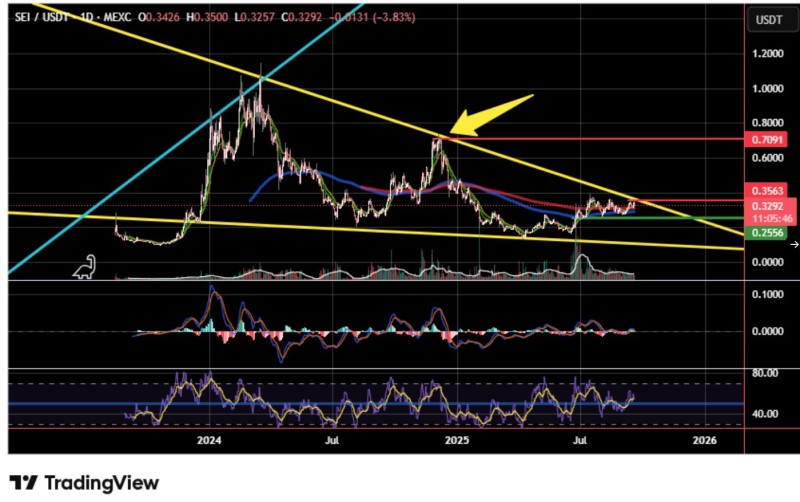
SEI faces strong wedge resistance near $0.35–$0.36, marked by repeated rejection points. Buyers have consistently defended the $0.25 level, keeping the structure intact. The RSI has bounced off the midline, while MACD shows early bullish alignment, hinting at growing buying pressure. A breakout could unleash momentum toward $0.70, aligning with key historical resistance and representing a potential +100% move.
Why It Matters Now
This setup is attracting attention not only for its technical clarity but also due to improving sentiment around the SEI ecosystem. SEI is gaining traction as efficient blockchain infrastructure for trading applications. Accumulation phases in recent months suggest long-term holders are positioning for upside, while broader altcoin momentum could amplify gains if risk appetite continues to rise.
Price Targets
If SEI breaks above $0.36 with strong volume, the path to $0.50 first, then $0.70 becomes realistic. Conversely, failure to push through resistance could mean another pullback toward the $0.25 support zone.
 Usman Salis


