 Peter Smith

SEI has been trading in a tightening range for several months, and the market is approaching a turning point. The cryptocurrency sits just below a key resistance level at $0.31, and many believe a decisive break here could set the stage for a major move toward $0.65 in the months ahead.
Chart Setup: Symmetrical Triangle Taking Shape
According to trader Ali, who recently shared his technical outlook, the daily SEI/USDT chart shows a textbook symmetrical triangle pattern that's been forming over an extended period.
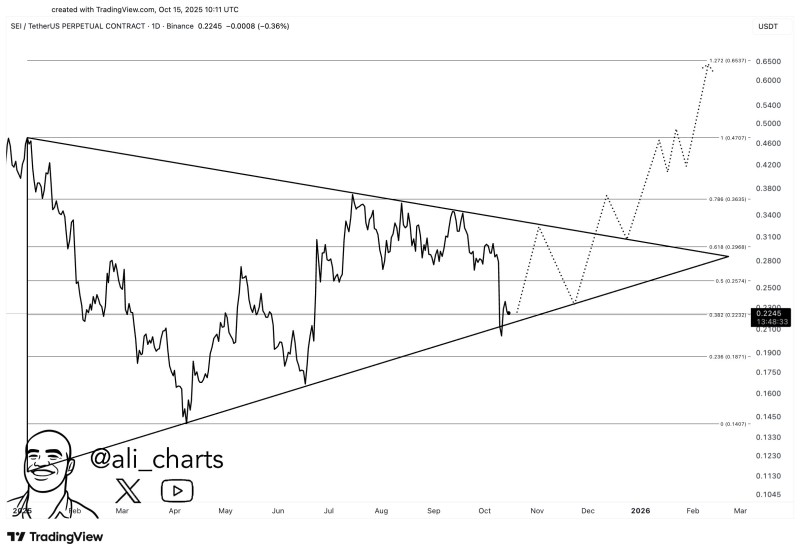
Support has held consistently around $0.22–$0.23, coinciding with the 0.382 Fibonacci retracement level, while resistance remains firmly planted at $0.31. If buyers manage to push through that ceiling, the path opens toward Fibonacci-based targets at $0.38, $0.47, and ultimately $0.65. The tightening price action signals decreasing volatility, which typically precedes a sharp directional move one way or the other.
Why This Matters Now
Several factors are drawing attention to SEI at this moment. There's growing rotation into mid-cap altcoins as larger projects stabilize and investors hunt for fresh opportunities. SEI's blockchain has been gaining traction in trading infrastructure and liquidity solutions, giving it stronger fundamentals than many competitors. Meanwhile, Bitcoin's recent stability has created a more favorable environment for risk-on plays across the altcoin market, and SEI appears positioned to benefit if sentiment continues improving.
What Comes Next: Two Scenarios
If SEI clears $0.31 with conviction, the technical setup suggests a run toward $0.47 and possibly $0.65, which would represent roughly a threefold gain from current levels. On the flip side, losing support at $0.22 would be a red flag, potentially opening the door to deeper pullbacks toward $0.19 or even $0.14 if momentum turns decisively bearish.
 Peter Smith


