Usman Salis
The SEI chart reveals a persistent downtrend spanning over a year, with each attempt to rally being stopped by the same descending trendline. The token is now testing this technical barrier again, and market participants are closely monitoring whether it can finally break through and shift momentum.
SEI Price Action Under Pressure
Since hitting a peak above $1.20 in early 2024, SEI has carved out a clear pattern of lower highs. The descending resistance line has turned back price rallies in November 2024, mid-2025, and most recently in September 2025. According to trader Ali, the question isn't if this resistance will eventually break, but when.
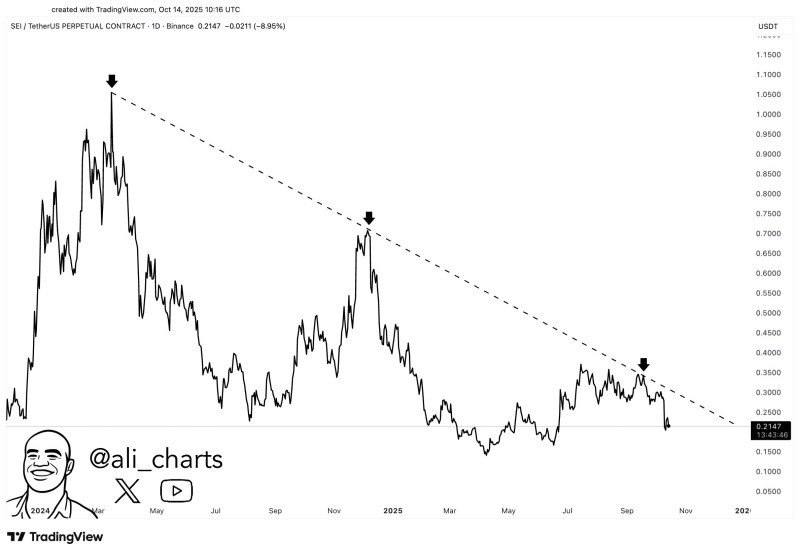
Currently, SEI sits near $0.21 after dropping nearly 9% in a single day. These repeated rejections underscore just how significant this trendline has become. Until SEI pushes above it with conviction, the bearish structure stays in place.
Why This Level Matters
Technical traders often treat descending resistance as a make-or-break threshold. A clean move above the $0.35–$0.40 zone would represent SEI's first real reversal in over a year and could spark a momentum-driven surge. Given SEI's track record of sharp rallies following trend shifts, a decisive break could lead to quick gains.
Market Drivers
Several factors could influence what happens next. Broader crypto sentiment plays a role - if Bitcoin finds stability or pushes higher, mid-cap tokens like SEI often see renewed interest and capital inflows. Adoption and ecosystem expansion matter too, as developer engagement and fresh integrations help determine whether any rally can hold. Finally, the recent sell-off may have cleared out weaker positions, potentially setting the stage for stronger participants to drive the next move.
What Comes Next
If SEI can't reclaim ground above $0.25, there's downside risk toward the $0.18–$0.20 range. But breaking through that long-term descending trendline could open a path toward $0.50 and beyond, consistent with the token's history of parabolic moves after major trend changes.
 Usman Salis