Saad Ullah

Litecoin is entering one of its most technically compressed phases in history, with momentum collapsing to historic lows even as price structure holds relatively firm. A chart shared by @CryptoSurf highlights a potential hidden bullish divergence forming on the monthly timeframe — a setup that typically emerges during prolonged consolidation rather than active downtrends.
Litecoin RSI Reaches Lowest Level Ever Recorded
The most striking element in the current chart is the Relative Strength Index, which has now fallen to its lowest point on record. This reflects sustained downside pressure stretched across an extended period of time.
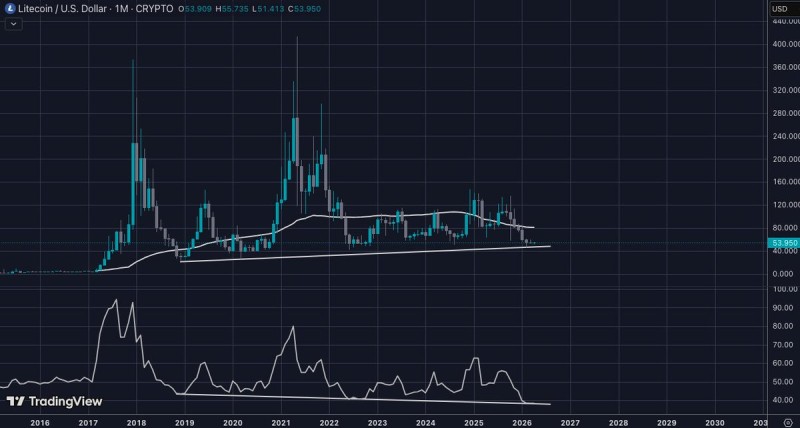
Momentum has already collapsed, but price has yet to fully respond — and that gap is exactly what makes this setup worth watching.
What makes this reading unusual is that price has not printed a significantly lower low compared to prior cycles. That creates the conditions for a hidden bullish divergence — a structure where momentum weakens but selling pressure appears to be quietly stabilizing beneath the surface. Unlike sharp reversals, this kind of pattern develops slowly. It is more consistent with accumulation than with any immediate breakout scenario.
Litecoin Trades Below 200-Week Moving Average
Another detail from the chart worth noting is that Litecoin is currently trading well below its 200-week moving average — a level widely used in crypto technical analysis as a long-term trend benchmark.
That positioning reinforces the broader bearish context. However, in previous cycles, similar conditions have aligned with late-stage consolidation zones rather than the early stages of downtrend expansion. Litecoin tests long-term support with major upside targets highlights how LTC has historically reacted near multi-year support levels, often setting the stage for large cyclical moves.
When price stops making lower lows while RSI keeps falling, you're often looking at a market that's quietly shifting hands — not breaking down further.
For now, Litecoin occupies a technically weak but structurally interesting zone. Downside momentum is no longer accelerating — and that alone is a meaningful shift.
Litecoin Price Compression Signals Possible Transition Phase
The chart reflects a prolonged period of sideways movement, with volatility gradually narrowing over time. Rather than printing aggressive lower lows, Litecoin appears to be settling into a tighter range. Litecoin holds multi-year support as wedge tightens notes that price has repeatedly respected long-term structural support as volatility contracts — a pattern consistent with accumulation behavior.
This kind of compression often marks a transition in market structure. Momentum stays weak, but price stops reacting with the same intensity. It is a subtle shift, but one that experienced traders monitor closely.
These are the setups nobody talks about until after they've already played out — extreme RSI, narrowing range, price holding structure.
Litecoin hits historical RSI lows before reversals shows that extreme RSI readings have previously coincided with major turning points in Litecoin's market cycle — adding historical weight to the current setup.
A Quiet Setup With Potentially Significant Implications
What defines the current structure is not what is happening — it is what has stopped happening. Selling pressure has not intensified despite momentum sitting at historically weak levels. That divergence between price stability and a declining RSI suggests a market that is no longer trending aggressively lower.
Instead, Litecoin appears to be entering a phase where positioning becomes more patient and less reactive. The chart reflects a market in balance — one where the momentum collapse has already occurred, but price has not yet made its next decisive move.
Whether that move comes sooner or later, the groundwork visible in this monthly structure is the kind that tends to matter over longer timeframes.
 Saad Ullah