 Usman Salis
⬤ Litecoin just hit a level against silver that's only been seen three times before in the past decade. Long-term chart data shows the current setup marks the fourth time Litecoin has dropped to extreme lows when measured against silver. Each previous instance marked a major turning point where the downtrend eventually reversed.
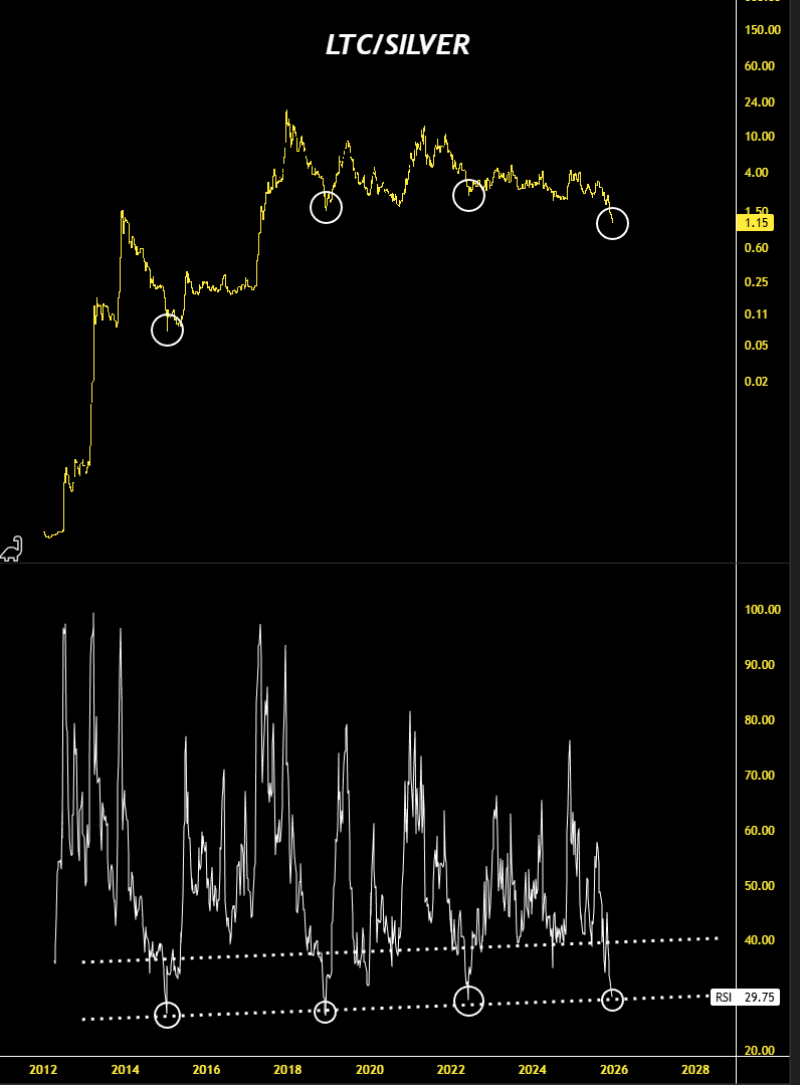
⬤ The LTC-to-silver ratio chart reveals four distinct periods where Litecoin experienced extended weakness before bouncing back. These compression zones, highlighted on the price curve, show where selling pressure dried up and prices stabilized. Right now, Litecoin is sitting near that same lower boundary—just like it did in 2014, 2018, and 2022.
⬤ The Relative Strength Index adds weight to this picture. Sitting at 29.75, the RSI has only dipped this low a handful of times in the entire timeframe. In the past, these oversold readings came right before Litecoin's momentum shifted. The pattern repeating now suggests the current position isn't random—it's part of a longer cycle.
⬤ What makes this relevant isn't just Litecoin's price action. The ratio between digital assets and traditional stores of value like silver can signal broader market shifts. Extended consolidation phases like this one have historically preceded changes in relative performance, making long-term ratio analysis a useful lens for understanding where we are in the market cycle.
 Usman Salis


