Saad Ullah

⬤ Litecoin drew traders' focus this week when new price analysis suggested an unusually large rally might appear in the coming weeks. The projection shows LTC rising toward the $1,500 - $2,000 zone by December, with the chart displaying more space for upward movement than for downward. The graph places Litecoin inside a long term squeeze and near a marked breakout area that resembles patterns seen before earlier major rallies.
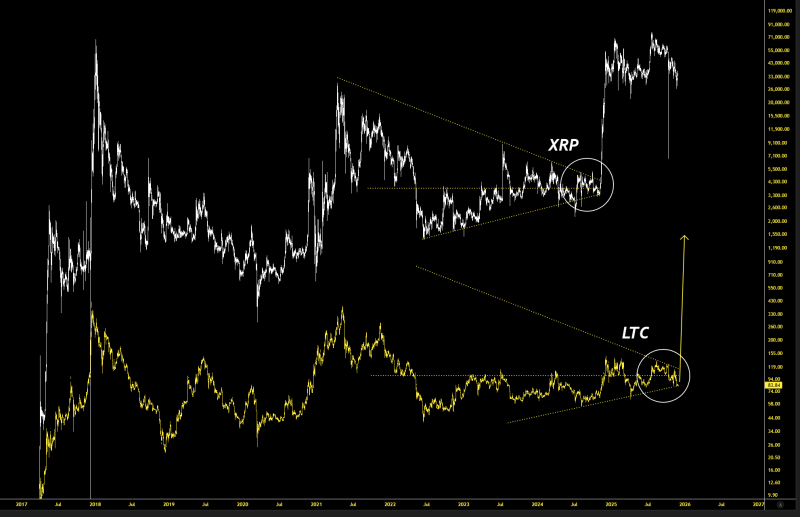
⬤ The analysis places XRP's historic multi year compression beside Litecoin's current action. XRP's old chart displays a long squeeze that ended in a sharp upward move - the same structure the analyst now sees in LTC. At present Litecoin trades between about $60 and $120 pressing against the top of that band. The marked zone shows trend lines that tighten - once resistance breaks, momentum may shift quickly.
⬤ Such volatility appears during crypto breakouts, particularly when assets exit long consolidations. The chart also shows dotted trend lines that form a descending channel and that have compressed price action over months. With LTC now grouped near this convergence area, the setup repeats the compression XRP showed before its large run indicating Litecoin may stand at a turning point in its wider cycle.
⬤ A large Litecoin breakout would matter for the whole crypto market, because those cyclic patterns and long squeezes often precede sharp volatility in older coins. If LTC now accelerates, it could reverse sentiment among traders who watch similar setups in other charts. Moves of this sort usually reshape views on liquidity flows and on trend continuation - Litecoin's next price move now sits in full view.
 Saad Ullah