Peter Smith

⬤ Litecoin on the 4-hour chart now shows renewed upward pressure. A fresh technical pattern signals that the short term trend may turn. After the coin climbed back above its track line, a bullish divergence appeared and produced a squeeze setup. The price stands near $85 plus a breakout arrow now indicates that a follow through move is likely.
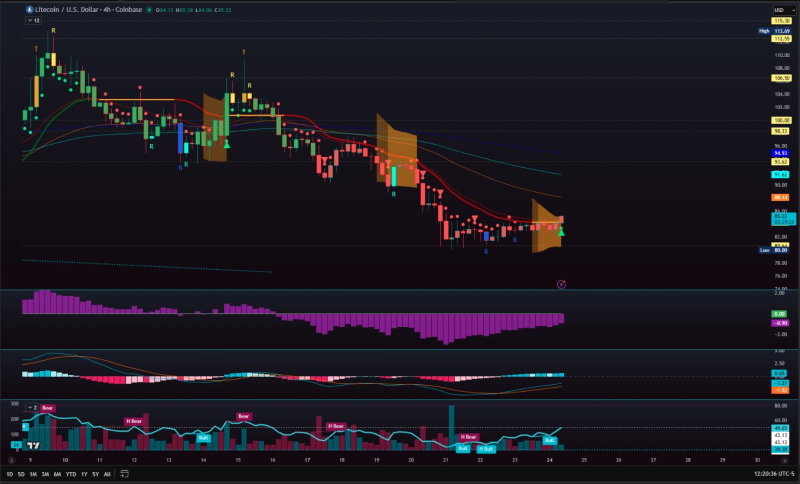
⬤ The chart reveals that LTC rebounded from about $80 after a week of steady selling. Price bars have narrowed, the short term moving averages have levelled and the squeeze zone has formed. The bullish divergence coincides with a rising histogram but also a steadier MACD, which together point to an early effort to create a firmer base. The return above the track line underlines this effort and shows the market regaining ground.
⬤ Further chart tools support the pattern. Momentum bars have lifted from deeply negative values toward neutral as well as oscillators display stronger buying at the recent lows. The arrow again highlights the $88 - $92 band, the zone stressed in the analysis. With the wider market moving little, any advance will hinge on LTC keeping its recent stability and gathering enough force to test the overhead barrier.
⬤ The compression together with the bullish divergence often precedes attempts to retake higher prices. The $88 - $92 region saw heavy trade earlier - a move into or through it would show that sentiment has improved. While the broad crypto market remains quiet, Litecoin's squeeze may draw traders who wait for momentum to widen or to confirm a clearer short term direction.
 Peter Smith