 Marina Lyubimova

⬤ HYPE has climbed back toward the $25 to $25.50 resistance zone on the 1-hour chart after bouncing from recent lows. This price area has rejected upside attempts before, and the current move is drawing attention as a potential reversal point. Weekend trading conditions add complexity since lower liquidity can amplify price swings in either direction.
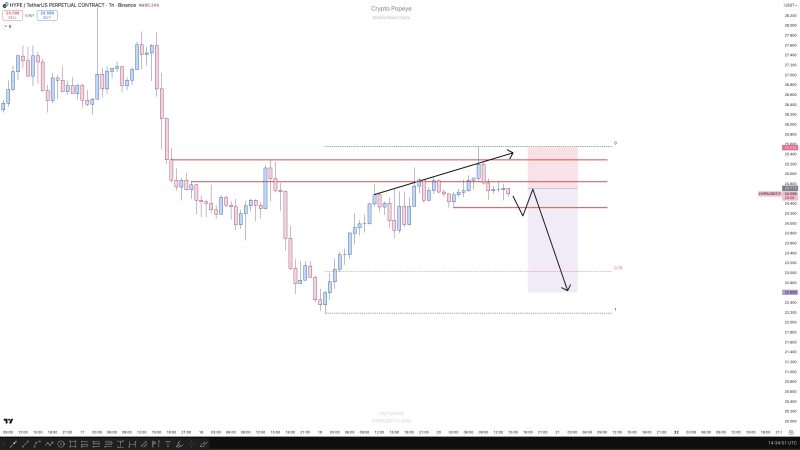
⬤ The chart shows a three-drive pattern pushing into resistance, followed by a sweep above the previous high. But here's the thing—price hasn't been able to hold above these levels. Recent candles show hesitation and choppy overlap rather than clean continuation. Multiple resistance lines are stacked in this zone, and the lack of strong follow-through suggests buyers might be running out of steam.
⬤ Momentum readings back up the cautious view. The 1-hour RSI shows fading upside strength, while the 4-hour RSI hovers near 50—basically neutral territory. On larger timeframes, HYPE remains locked in a downtrend, meaning this rally could just be a temporary correction. If resistance holds and nearby support breaks, the chart maps out a path lower.
⬤ This matters because it shows how rallies can stall when they run into resistance during a broader downtrend. With HYPE testing key levels on a low-volume weekend, the reaction here could set the tone for near-term price action. A clean rejection would favor the bears, while a break above resistance might shift momentum—at least temporarily.
 Marina Lyubimova


