 Sergey Diakov

⬤ Ethereum is approaching a key decision zone as price interacts with a support and resistance flip area on the 4-hour chart. ETH has been trading near the $2,050 level after a steady decline from highs above $2,300, with repeated lower highs confirming weakening momentum. As Trader Tardigrade noted, markets are closely watching whether this level holds or gives way, since the outcome will define the next meaningful directional move.
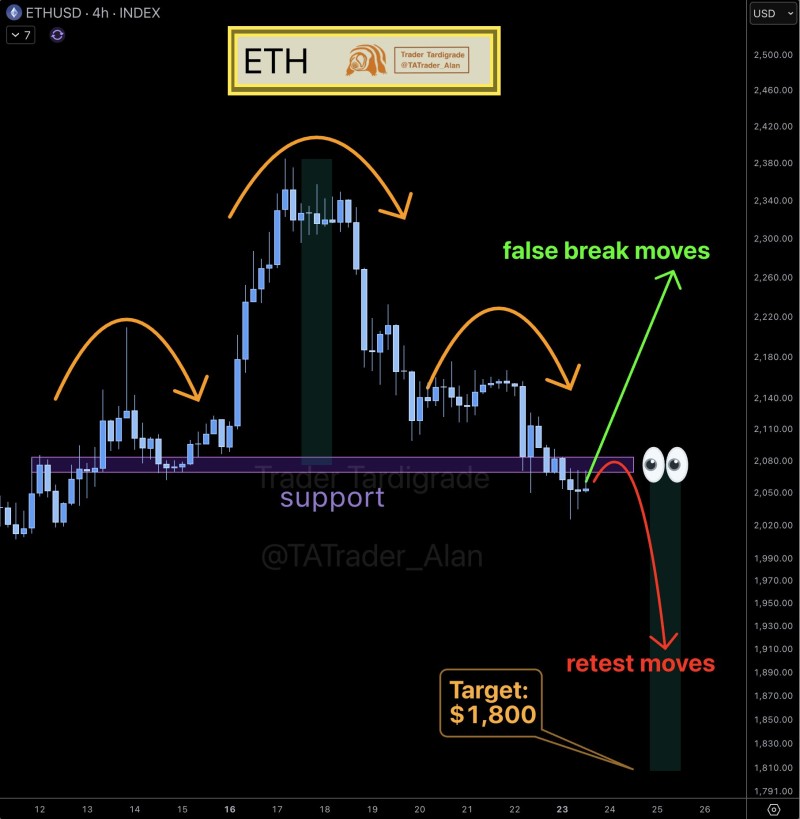
⬤ The chart structure shows a clear downtrend with successive failed rallies and mounting pressure on the marked support zone. This area previously acted as resistance and is now being tested as support. As covered in ETH Rejected Near $2,000: Key Support at $1,850-$1,900 Now in Focus, failing to hold critical levels tends to accelerate moves toward lower demand zones.
⬤ Two scenarios are on the table. A false breakdown could occur if ETH dips briefly below the support zone and quickly reclaims it, trapping sellers and sparking a reversal. Alternatively, a clean break below followed by a retest from underneath would confirm bearish continuation. This mirrors the setups examined in Ethereum Eyes $1,920-$1,930 Support Zone After Recent Pullback and Ethereum Struggles Below $2,100 Resistance as Traders Watch for Breakout Signal, where horizontal zones determined directional bias. Sustained bearish momentum points to a downside target near $1,800.
⬤ Current ETH positioning reflects a short-term inflection point driven entirely by support and resistance dynamics. Price reactions at major technical zones often trigger sharp transitions in sentiment, particularly after extended sequences of lower highs and failed recovery attempts. How ETH resolves this test will set the tone for near-term trader positioning.
 Sergey Diakov


