 Usman Salis

⬤ Ethereum's been moving inside a tight rising channel lately, and the pattern's keeping things pretty organized. The price keeps bouncing between the upper and lower lines of this formation, with resistance near the top slowing things down while support at the bottom stays solid. Each time the price touches that lower trendline, buyers step in and push it back up, creating those higher lows that traders like to see.
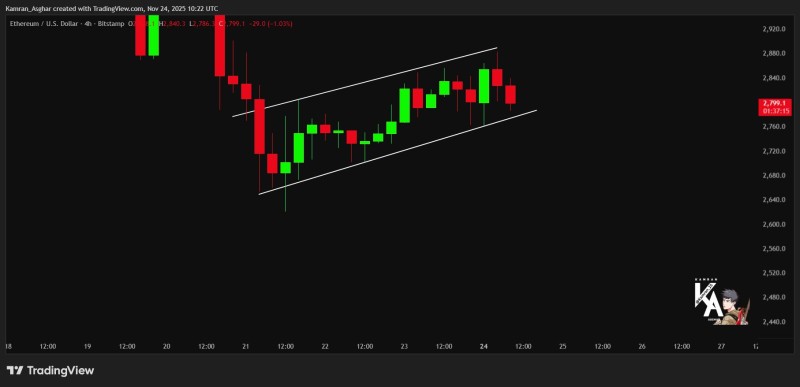
⬤ Right now, Ethereum's trading in a range between roughly $2,760 and $2,840 on the four-hour chart. Every time it tries to break through that upper boundary, it pulls back a bit—there's clearly some selling pressure waiting at that level. But here's the thing: the lower trendline keeps doing its job. Price hits it, bounces, and continues the upward pattern. This kind of controlled movement shows accumulation happening in the background rather than wild swings driven by panic or FOMO.
⬤ The recent candles show Ethereum backing off from the upper boundary and hanging around the middle of the channel. That's actually pretty normal for these rising formations. You get these brief consolidation periods where the market catches its breath before deciding on the next move. As long as that lower trendline holds up, the easier path is still pointing higher. The chart's telling a clear story here—both boundaries matter, and traders are definitely paying attention to them.
⬤ What makes this pattern worth watching is how Ethereum tends to influence the broader crypto market. When ETH maintains a steady, well-defined upward channel like this, it creates a stabilizing effect across major digital assets. Other coins often take cues from Ethereum's movement, especially when the structure looks this clean. The pattern staying intact keeps the constructive tone alive in the market and maintains that upward bias as long as support levels keep holding. If that lower trendline breaks, though, things could shift pretty quickly.
 Usman Salis


