Peter Smith

Ethereum (ETH) impressive rally above $4,000 may be hitting a temporary roadblock. Recent technical analysis shows warning signs of a potential pullback, with key indicators suggesting the current uptrend might need to cool off before continuing higher. Market participants are now closely monitoring critical support levels that could define ETH's next move.
TD Sequential Signals Short-Term Exhaustion
Ali, a well-known on-chain and technical analyst, recently highlighted that the TD Sequential indicator has triggered a sell signal on the 4-hour ETH/USD chart. This development typically warns of a short-term exhaustion phase within an ongoing uptrend.
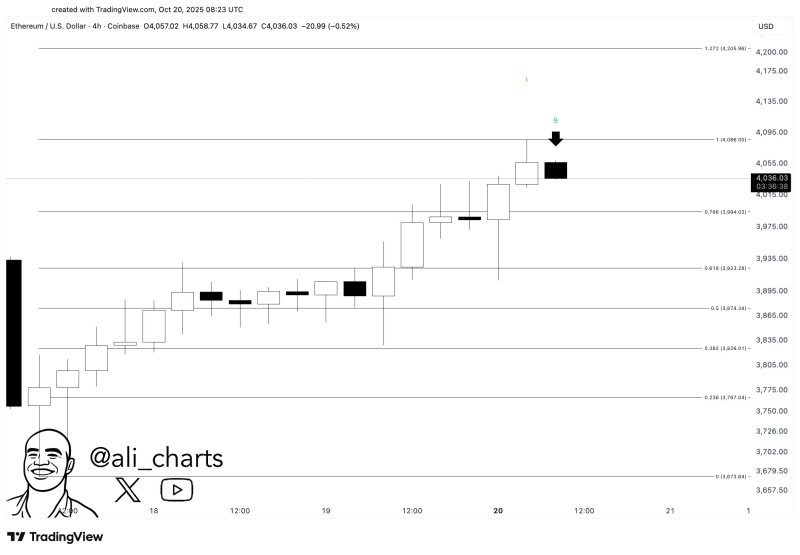
The chart shows the "9" count appearing near $4,085, marked by a black arrow after a steady series of bullish candles. This pattern historically indicates overextension, suggesting buyers may start taking profits. The current price action already shows hesitation, with ETH hovering around $4,036 at the time of posting.
Key Technical Levels to Watch
From a technical perspective, Ethereum now faces several critical price zones:
- Immediate resistance: $4,085–$4,100
- Initial support: $3,994 (0.786 Fibonacci retracement)
- Major support target: $3,900 (0.618 Fibonacci retracement)
- Extended correction zone: $3,870–$3,835
Traders should monitor whether ETH holds strength above $4,000 in upcoming sessions. A confirmed drop below $3,994 would validate the bearish signal, while recovery above $4,085 would invalidate it and likely restore bullish momentum.
Broader Trend Remains Constructive
Despite the short-term sell signal, the broader market trend stays bullish. Ethereum continues trading within a higher-high, higher-low structure, and such pullbacks often serve as healthy pauses within larger upward cycles. The long-term technical picture remains constructive as long as price holds above $3,900. For now, the chart suggests Ethereum is entering a brief cooldown before its next directional move.
 Peter Smith