 Saad Ullah

Ethereum (ETH) long-term price chart may be flashing signals that another significant upward move is approaching. The technical setup forming right now bears a striking resemblance to the patterns that appeared just before ETH's historic rallies in previous cycles. With key momentum indicators turning positive and the structure repeating itself once again, the stage could be set for the next major expansion phase in Ethereum's ongoing market cycle.
Familiar Pattern Emerging Again
Crypto analyst Javon Marks recently highlighted that Ethereum appears to be following the same technical blueprint that preceded its explosive 2020-2021 run. The multi-year chart reveals a consistent rhythm of expansion and pullback cycles, where each correction has historically laid the groundwork for a powerful continuation move.
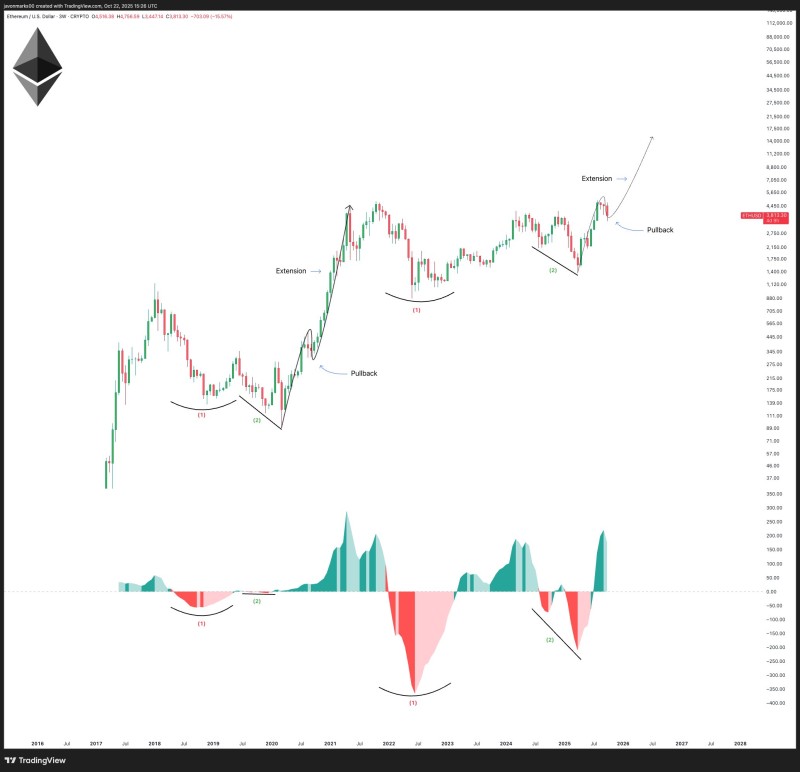
The first cycle between 2018 and 2020 formed a rounded bottom before prices surged dramatically higher. The second cycle from 2021 to 2023 followed a similar path, pushing to fresh peaks before entering a deep correction phase. Now the third cycle spanning 2024 to 2025 seems to be unfolding in that same recognizable fashion, showing recovery from a macro bottom, a clean retracement, and what looks like a new extension beginning to take shape.
Momentum Indicators Support the View
The MACD histogram reinforces what the price structure is suggesting. Looking at each major cycle, there's been a deep negative reading in momentum followed by a steady climb back up, which typically signals a long-term trend reversal is underway. Right now the MACD is showing another positive divergence, meaning that even as prices pulled back recently, the underlying momentum has actually turned upward. This mirrors exactly what happened before Ethereum's previous bull runs began. The pattern suggests ETH is quietly building strength for a substantial move higher, assuming the support zone between $3,500 and $3,700 holds firm.
Why This Pattern Matters for the Broader Market
Ethereum's cyclical behavior has long served as a bellwether for the wider crypto ecosystem. When ETH enters an expansion phase, it typically triggers a liquidity shift across major altcoins and sparks increased activity in decentralized finance. Beyond just price action, on-chain data tells a compelling story too. Staking participation continues to grow, Layer-2 adoption is accelerating, and these fundamentals suggest that Ethereum's underlying network value keeps expanding even when prices temporarily correct. These aren't just technical signals in isolation but reflect real activity and development happening across the ecosystem.
Current Sentiment and What Could Come Next
Market sentiment remains decidedly optimistic, with over 83% of community participants on CoinMarketCap expressing bullish expectations for Ethereum's price trajectory. If this technical pattern plays out the way it has in previous cycles, the next expansion could drive ETH toward new multi-year highs. Some analysts are eyeing a potential move toward the $8,000 to $10,000 range over the longer term. That said, pullbacks are a natural and healthy part of any sustained uptrend, and maintaining those key support levels will be essential for confirming that the continuation is actually underway rather than a false signal.
 Saad Ullah


