 Usman Salis

⬤ Ethereum dropped into the $2,250 zone on the daily chart, hitting a downside target that analysts had been tracking for weeks. The move completes a broader corrective pattern, with price landing in a crucial Fibonacci retracement area that's been closely monitored throughout the selloff.
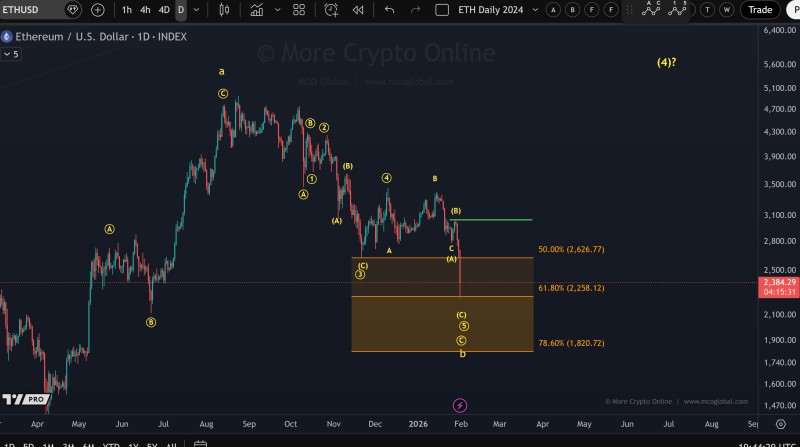
⬤ The chart shows Ethereum's descent from highs above $4,000, playing out through multiple corrective waves. Price broke through several support levels before accelerating into the target zone. Key technical markers include the 50% retracement near $2,626, the 61.8% level at roughly $2,258, and the deeper 78.6% retracement around $1,820. Ethereum's arrival at $2,250 puts it right at the 61.8% Fibonacci level—a spot traders often watch for potential shifts in momentum.
⬤ The decline unfolded in a measured way rather than a panic-driven crash. Earlier bounce attempts failed below resistance, keeping the downtrend intact until reaching this target area. The chart frames this as part of a larger corrective phase, with the current zone now acting as a critical test for any upside reversal. While no confirmed turnaround has appeared yet, the level itself marks the completion of the expected downward move.
⬤ What happens at $2,250 matters for the broader crypto market since Ethereum often sets the tone for overall sentiment. A stabilization or strong reaction from this area could shift near-term expectations across digital assets, while continued weakness would keep focus on the lower Fibonacci levels.
 Usman Salis


