 Usman Salis

Ethereum (ETH) has hit a pivotal moment as traders watch for warning signs on its weekly chart. A bearish MACD crossover is developing - a technical event that historically hasn't ended well for ETH holders. After a solid rally earlier this year, this setup is putting investors on alert.
Technical Setup and MACD Warning
According to analyst Ali, the MACD (Moving Average Convergence Divergence) on Ethereum's weekly timeframe is approaching a bearish cross.
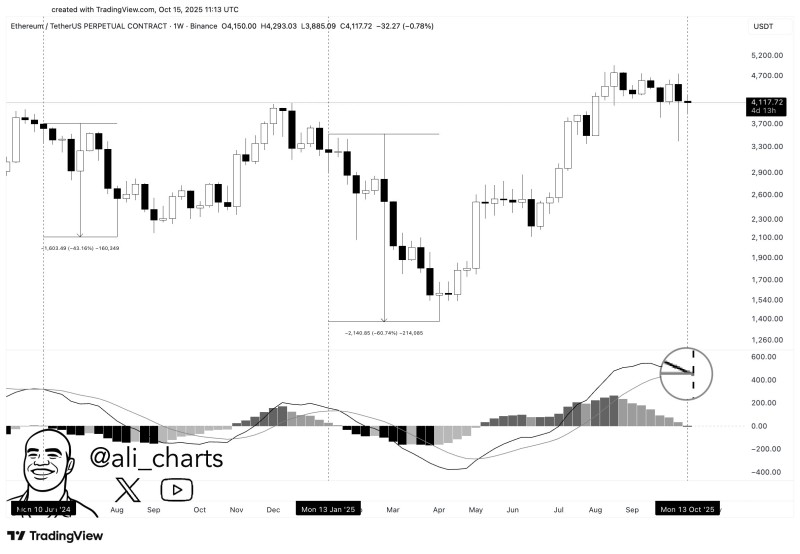
The last two times this happened, ETH dropped 43% and 61% respectively. The MACD tracks momentum by comparing two moving averages. When the MACD line dips below the signal line, it typically means momentum is fading and a bigger pullback could be coming.
Chart Analysis: Key Levels in Focus
Right now, Ethereum is consolidating around $4,117 after its recent run-up. If selling picks up, the first support zones to watch are $3,700 and $3,300. On the upside, any recovery attempts might stall between $4,500 and $4,700, where ETH previously struggled. Looking back, previous bearish MACD signals on this timeframe led to multi-month downtrends, which shows how seriously traders take this pattern.
Market Context and Broader Drivers
This warning comes during a tense period for global markets. Crypto liquidity has dried up somewhat, and Bitcoin's stall near resistance has slowed down the entire sector. Ethereum's fundamentals - staking growth, layer-2 expansion, and tokenization projects - look solid, but that might not be enough to fight off near-term technical pressure.
 Usman Salis


