 Saad Ullah

⬤ Ethereum (ETH) is building a major inverse head and shoulders pattern on the weekly chart that's caught traders' attention. The pattern has been developing over several months, with ETH currently trading near $3,122 just below the neckline resistance. This sloping neckline connects multiple highs and represents the key barrier ETH needs to break through to confirm the bullish setup.
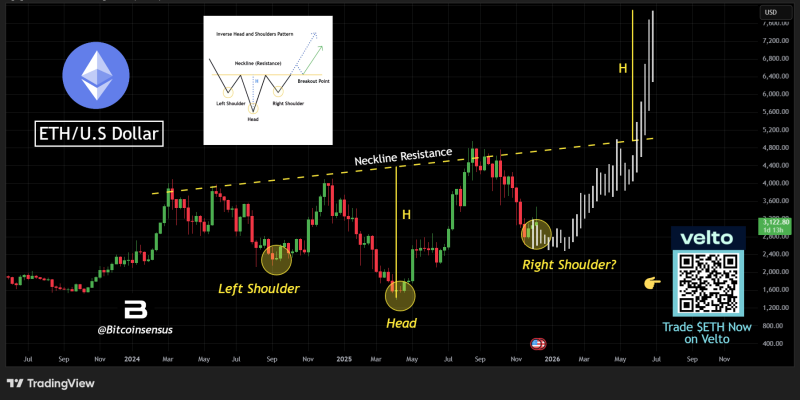
⬤ The weekly chart clearly shows the left shoulder, head, and right shoulder taking shape. Using the classic measurement method—taking the distance from the head to the neckline and projecting it upward from the breakout point—the pattern suggests a target around $7,600 if ETH clears the neckline. That's more than double the current price, making this a serious macro setup worth watching.
⬤ The chart includes a height marker labeled "H" showing exactly how the $7,600 projection is calculated, along with projected candles illustrating where price could head after a breakout. The key thing to remember is that ETH needs a weekly close above that neckline to validate the pattern—anything less is just noise.
⬤ This matters because Ethereum is the second-largest crypto by market cap, and when ETH makes big technical moves, it usually drags the rest of the market along. The neckline stays the critical level to watch. Break it on a weekly basis, and ETH could be heading toward $7,600. Fail to break it, and the pattern falls apart.
 Saad Ullah


