 Usman Salis

⬤ Ethereum (ETH) is hanging around the $2,900 mark, and this price level is turning into a real test for short-term support. Recent ETH/USD charts show ETH trading near $2,919.98, trending lower on the hourly timeframe and sliding toward the key support band. If Ethereum clearly loses $2,900, it could open the door to a bigger drop, making this zone crucial to watch right now.
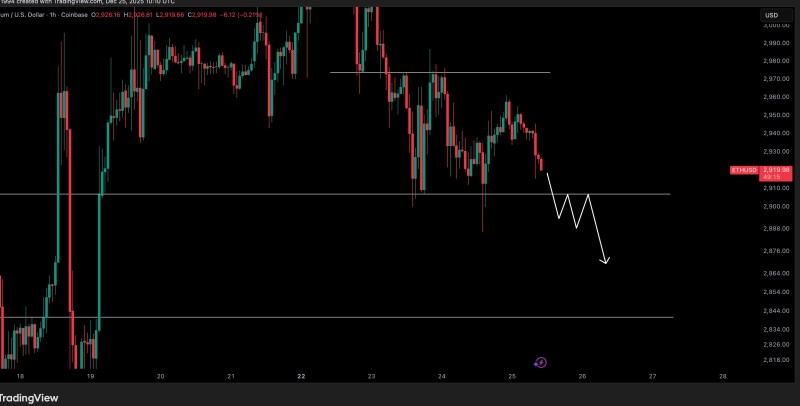
⬤ The chart shows recent price swings hitting resistance around $2,960 to $2,970 before pulling back steadily toward the lower boundary. A horizontal support line sits near $2,900, marking an area where price has bounced before. The projection shows a potential brief pause at this level before breaking lower, indicated by a white zigzag and downward arrow.
⬤ Ethereum has seen repeated intraday volatility lately, with sharp price wicks in both directions. But it hasn't been able to reclaim the upper resistance zone, which puts even more focus on the structural support below. Price remains inside a visible short-term downtrend channel, adding to the concern around the $2,900 threshold. The marked lower target region sits well below current pricing, showing the focus here is on downside risk rather than upside momentum.
⬤ This matters because Ethereum is one of the biggest and most actively traded crypto assets. Key levels like $2,900 on ETH/USD shape near-term market sentiment. A clean break below could signal weakening momentum and spark more volatility. On the flip side, if Ethereum holds above support, it might stabilize the short-term outlook and give traders some breathing room.
 Usman Salis


