 Artem Voloskovets

⬤ Ethereum has pushed through a key descending trendline on the 1-hour chart, marking a clear shift in short-term momentum. The breakout came after ETH bottomed near $2,740 and began climbing back. This looks like the start of a corrective wave b recovery rather than a full trend reversal. The move higher fits with a bounce scenario, though the internal structure of b-wave recoveries tends to be messy and unpredictable.
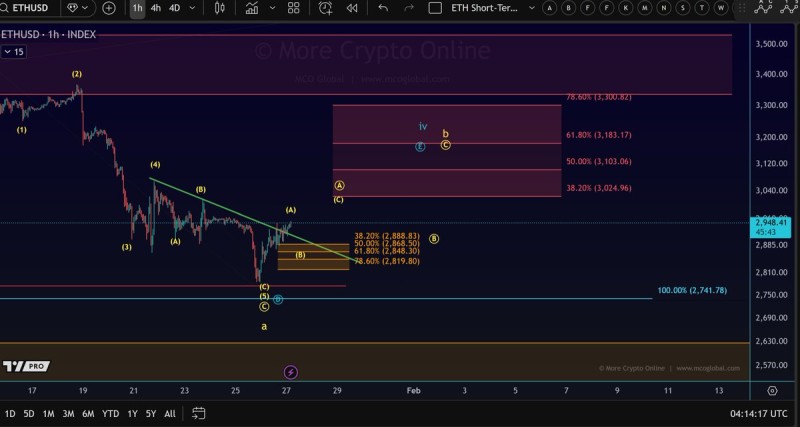
⬤ The chart shows ETH finding support around $2,740 before reclaiming the trendline that had been capping rallies. Price is now trading near $2,950, sitting between several important Fibonacci levels. Micro support has been adjusted slightly to reflect how the short-term structure is evolving. This isn't about calling a bottom—it's about tracking where the corrective bounce is happening.
⬤ Fibonacci retracement zones are shaping the current setup. On the downside, levels near $2,885, $2,848, and $2,819 mark the adjusted micro support area where price could find buyers during pullbacks. On the upside, resistance sits between roughly $3,025 and $3,300, covering the 38.2%, 50%, and 61.8% retracement levels of the prior drop. Price action within these zones reflects the typical choppiness you see during corrective waves.
⬤ This analysis matters because it frames the trendline break as part of a correction, not a new uptrend. B-waves are known for being tricky and non-linear, so keeping expectations flexible makes sense. How ETH reacts around these Fibonacci zones could influence short-term sentiment and set the tone for the next directional move across crypto markets.
 Artem Voloskovets


