 Peter Smith

Ethereum is approaching a pivotal technical moment as its weekly MACD lines begin to converge from below. Max Crypto was among the first to flag the setup, noting that a bullish crossover is forming on the weekly timeframe - the same configuration that, historically, preceded a rapid and significant price expansion.
ETH Momentum Signal Takes Shape on Weekly Chart
The MACD structure is clear: the faster line is moving toward a cross above the signal line, transitioning from negative to positive momentum territory. The crossover has not fully confirmed yet, but markets often react before full completion when higher timeframe signals begin to align this closely.
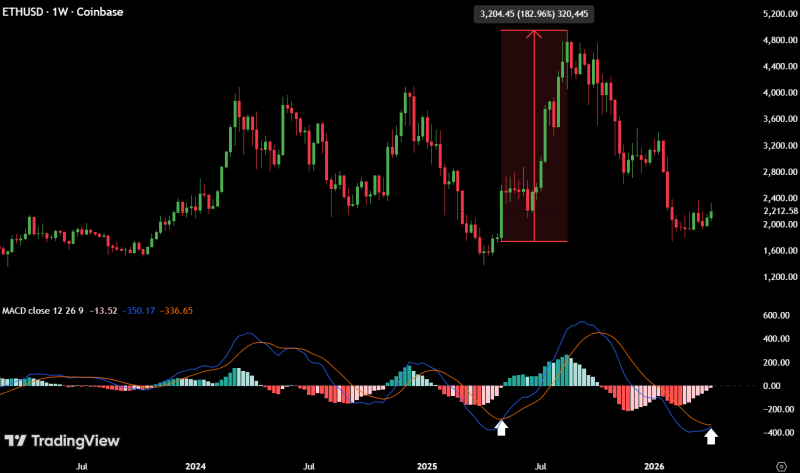
Selling pressure is fading and buying strength is starting to build - the weekly MACD is telling that story right now.
This kind of shift reflects a genuine change in market character - not just noise. Selling pressure is receding while buyers begin to establish a presence, and on a weekly chart, that transition carries weight.
Ethereum MACD Pattern Previously Led to Sharp Expansion
The chart contains a direct historical reference point. A similar MACD crossover occurred at an earlier stage in Ethereum's cycle, and that signal preceded a strong, accelerated rally over a relatively compressed timeframe.
The last time this setup appeared on the weekly chart, Ethereum moved fast and hard to the upside.
This historical parallel is central to why traders are watching the current formation. It does not guarantee repetition, but it places the current moment inside a familiar technical framework that has delivered meaningful results before.
Ethereum Holds Near Key Trendline With $2,100 Support in Focus offers additional context - the weekly chart in that analysis shows momentum flattening near support, a condition frequently observed before directional moves develop.
ETH Price Structure Aligns With Developing MACD Signal
Price action itself is cooperating with the developing signal. After a period of decline, Ethereum has entered a stabilization phase - no longer printing aggressive new lows, and showing signs of base formation rather than continuation lower.
This kind of structure tends to coincide with momentum resets, where indicators like MACD begin turning before price fully trends in a new direction. The alignment between structure and momentum is what gives this setup its weight.
When price stabilizes and the weekly MACD starts turning at the same time, you have a setup that is worth paying close attention to.
That said, contrasting setups do exist. Ethereum Faces Bearish MACD Signal: Historical Patterns Point to Risk serves as a reminder that weekly MACD signals historically produce large moves in both directions - which is precisely why confirmation matters before positioning around any single signal.
A related case, Ethereum Price Holds Strong as Binance Open Interest Hits Record High - Rally Coming?, highlights how momentum indicators and price structure can align during consolidation phases ahead of continuation moves.
A Developing Setup That Needs One More Step
The MACD crossover is forming. Price is stabilizing. Momentum is shifting. The pieces are in place - but confirmation has not arrived yet.
If the weekly crossover completes, it would mark a clear transition into bullish momentum on the highest timeframe most swing traders monitor. Until that happens, the signal remains a developing condition rather than a confirmed directional call.
Ethereum is sitting at a juncture where indicator behavior and price structure are starting to speak the same language. Whether that alignment fully materializes will define what comes next.
 Peter Smith


