Usman Salis

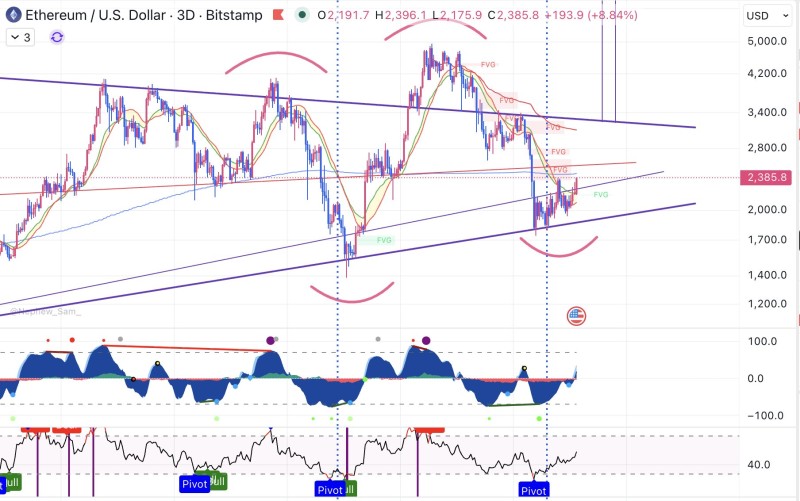
Ethereum is once again pressing into one of its most watched long-term indicators. After a recent recovery, price has moved back into the 200-week moving average - a zone the market has visited multiple times without delivering a clean resolution. The current interaction looks different from past rejections, though. Rather than fading sharply on contact, ETH is holding near the level and continuing to test it, suggesting something closer to accumulation than failure.
Lourenço VS flagged the setup, pointing out that this new encounter with the 200-week moving average follows a "Blue Ball" signal on the CUO 3-day indicator. That momentum trigger preceded the current push upward, and the chart structure reflects the shift - price has rebuilt from lower levels and is now sitting directly beneath resistance rather than trading away from it.
Ethereum's Momentum Shift Into Resistance
What makes this encounter worth watching is the sequence behind it. The 3-day momentum signal fired first, then price followed. That order matters because it suggests the move isn't simply noise or a brief spike into a known level - there's an underlying directional shift supporting the push.
The 200-week moving average has been a defining line for ETH across multiple cycles. Each time price returns to it, the interaction reveals where real demand sits.
The chart confirms the recovery structure: multiple recent candles pressing into the same zone without a sharp rejection. That kind of persistence tends to reflect sustained buying interest rather than a failed breakout attempt.
ETH Price Analysis: Ethereum Hits $2,380, Eyes $2,500 Breakout covers a comparable phase, where momentum built steadily beneath resistance before price moved into expansion.
Why Ethereum's $3,100 Zone Matters
The second reference point in the analysis is the anchored VWAP level sitting near $3,100. If Ethereum clears the 200-week moving average, that level becomes the next logical area of interest - a zone where prior positioning and price interaction tend to cluster.
If price can get above the moving average and hold, $3,100 becomes the natural target. That's where the anchored VWAP pulls price if momentum continues.
It's worth noting that $3,100 isn't a random figure. Anchored VWAP levels carry weight because they reflect the average cost basis of participants who entered at a specific point in time. When price approaches from below, those levels often act as magnets or, alternatively, as areas of distribution.
Ethereum Price News: ETH Approaches Major RSI Trendline Signal examines a related dynamic, where momentum compression ahead of a key signal set the stage for a directional move.
ETH Retesting the 200-Week MA - What the Setup Requires
The structure right now is conditional, not confirmed. Three elements define the current picture:
- Price repeatedly interacting with the 200-week moving average without a sharp rejection
- Momentum improving following the 3-day CUO signal
- $3,100 identified as the next reference level above current price
A breakout here wouldn't come out of nowhere. The groundwork - the signal, the recovery structure, the repeated tests - has been building for a while.
Ethereum hasn't broken above resistance yet. But it isn't trading away from it either. That distinction matters when reading the setup - persistence at a level like this tends to resolve one way or the other, and the current momentum context leans constructive.
ETH Price Analysis: Ethereum Tests $3,000 as Market Eyes $3,800 Recovery focuses on how reclaiming levels like the 200-week MA can define the next directional phase and open the path toward higher targets.
 Usman Salis