Artem Voloskovets

Dogecoin is approaching a technically critical moment after months of steady decline, with price now pressing into a long-standing resistance trendline while holding near support. Osemka flagged the setup, noting that DOGE is retesting a macro diagonal resistance after reclaiming its EMA. The chart reflects a shift from passive downside drift into a potential inflection point.
Dogecoin Downtrend Line Still Controls the Chart
The chart clearly shows a persistent downtrend, with multiple rejections marked along the same descending trendline. Each prior rally failed at this level, reinforcing it as the dominant resistance controlling price.
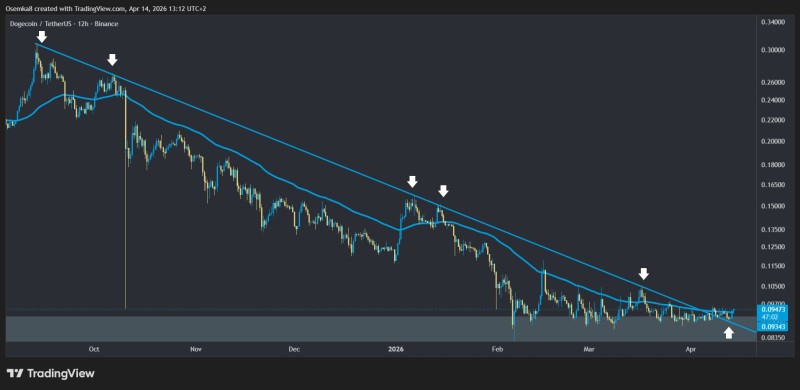
The downtrend trendline has seen multiple rejections, and each failed rally reinforces it as the key resistance level for Dogecoin right now.
Now, price is once again approaching that line - but from a more stable position, after holding near a horizontal support zone around the $0.09 area. Dogecoin Nears Breakout After Long Consolidation - Target Zone $0.14-$0.18 highlights a comparable compression phase near support that played out in a similar fashion.
EMA Reclaim Signals a Shift in DOGE Behavior
A key detail in the analysis is the reclaim of the EMA. This is visible on the chart, where price has moved back above the moving average after spending extended time below it.
This reclaim does not confirm a breakout, but it marks a clear change in short-term behavior. Instead of being rejected beneath dynamic resistance, price is now holding closer to it and pushing upward.
Reclaiming the EMA after an extended period below it is a behavioral shift - it does not confirm a breakout, but it changes the character of the move.
Dogecoin Compression Sets the Stage for a Directional Move
The structure shows DOGE consolidating tightly between horizontal support and descending resistance. Price is no longer making aggressive lower lows, instead stabilizing and compressing near the lower boundary. This type of price action reflects a market that is no longer trending lower, but also not yet breaking higher - a transitional phase.
The chart setup can be summarized as:
- Descending trendline acting as resistance
- Price reclaiming EMA
- Tight consolidation above support near $0.09
Dogecoin Faces $0.10 Breakout Decision: 2 Scenarios to Watch focuses on the same type of tightening structure that forces a directional resolution - either up through resistance or back toward the lower range.
One Trigger Away From a Breakout
The breakout thesis depends on a single condition: price breaking above the descending resistance. Until that happens, the structure remains intact. But repeated tests of resistance without breakdown can signal weakening selling pressure.
When price keeps testing resistance and fails to break lower, it often means sellers are losing control. The structure stays valid until it does not.
Similar setups in Dogecoin have often preceded volatility expansion, especially when price compresses between support and resistance before resolving directionally. DOGE Price Prediction: Dogecoin Triangle Signals a 2,500% Move Toward $2 explores how long-term compression patterns of this kind can lead to significant expansions once price finally commits to a direction.
 Artem Voloskovets