 Saad Ullah

Ethereum came under heavy pressure, briefly dropping toward $2,200 before finding support. As Ted noted, this zone is now the key level on the chart - with price reacting directly from it. The structure shows ETH trying to hold above support, but the broader trend remains fragile after the breakdown.
The Move That Brought ETH Into Support
The chart shows a sharp selloff that drove Ethereum from higher levels down into the $2,150-$2,200 region. This move marked a clear shift from prior stability into a more reactive structure, with price accelerating quickly into support.
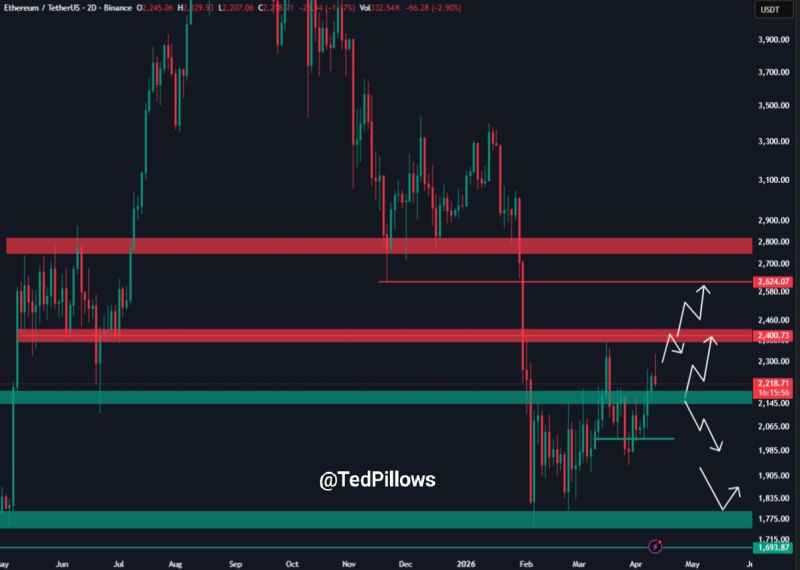
The reaction from that zone was immediate - ETH bounced after testing it, confirming that buyers are active there for now. However, the speed of the move lower also highlights how quickly downside momentum can develop when structure breaks.
Why This Zone Now Defines the ETH Next Move
The $2,150-$2,200 range is now the most important area on the chart. Price is currently sitting just above it - making it the dividing line between stabilization and continuation lower.
If this zone holds, Ethereum has room to push higher from current levels. If it fails, the structure opens to the downside - a breakdown below this support would likely lead to a move toward $2,000, which stands out as the next key area on the chart.
ETH Stalls Below $2,200 Despite 0.62% Daily Bounce shows how the $2,200 level has been a two-sided battleground - capping recoveries from below and now being tested as support from above in the current structure.
ETH Market Pausing After the Drop
Recent candles show a transition from aggressive selling into slower, choppier price action. That shift reflects a pause rather than a confirmed recovery. The current setup is defined by a clear binary outcome:
- ETH tested the $2,150-$2,200 support zone
- Price bounced after nearly reaching $2,200
- Holding this level opens room for a move higher
- Losing it exposes downside toward $2,000
ETH Holds $2,000 by a Thread as Sellers Keep Rejecting Every Bounce outlines what the downside scenario looks like if $2,200 fails - showing how $2,000 has previously been a level where Ethereum found its most critical support, and why losing the current zone would bring that level back into focus quickly. ETH Price Analysis: Ethereum Struggles Near $2,046 as Bearish Pressure Builds reinforces the bearish pressure context, showing that the space between $2,200 and $2,000 has not offered much structural support in recent price history.
 Saad Ullah


