 Eseandre Mordi

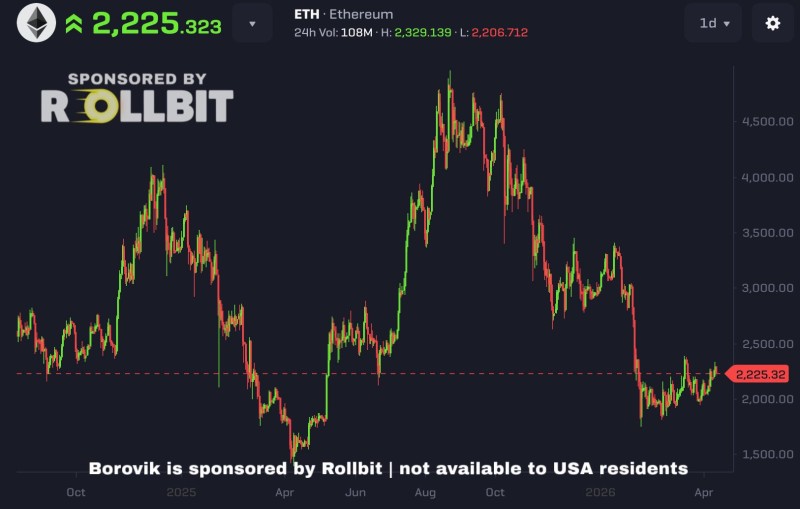
Ethereum is once again trading near a critical equilibrium zone around $2,200, following a prolonged period of sharp upside expansions and equally aggressive selloffs. Crypto analyst borovik outlined the full sequence driving current market sentiment, pointing to a pattern that has repeatedly failed to sustain directional momentum - instead oscillating between major highs and deep corrections, reinforcing the "rollercoaster" narrative defining ETH's recent price history.
A Market Defined by Violent ETH Price Cycles
Ethereum's journey through recent cycles reads like a stress test: $2.5K to $4K to $1.4K to $4.9K to $1.8K. This sequence reflects a pattern of explosive rallies followed by equally sharp drawdowns, with no clear long-term trend continuation emerging from the data.
On the chart, this translates into large cyclical swings rather than a steady progression of higher highs. Each rally phase is eventually capped by strong selling pressure, leading to deep retracements that reset market structure. This type of behavior aligns with broader observations across Ethereum markets, where price repeatedly moves between major zones rather than sustaining directional breakouts.
Where Ethereum Structure Broke Down
The most recent rejection from the $4,800 - $5,000 region marked a clear turning point. From that peak, Ethereum entered a corrective phase, losing key levels and forming a sequence of lower highs. The breakdown accelerated as price moved below mid-range structure and pushed toward the $1,800 zone - an area that now stands out as a key reaction point where buyers stepped in to halt the decline.
The $1,800 zone absorbed enough selling pressure to matter - but that doesn't make it a floor.
Similar behavior has been observed in recent ETH technical setups, where price struggles to reclaim higher resistance while remaining locked in corrective structures.
Compression Around a Critical Ethereum Pivot at $2,200
At present, Ethereum is consolidating around $2,200 - $2,300, repeatedly interacting with this horizontal level. The chart shows this zone acting as a pivot, where price has stalled after the latest rebound from sub-$2,000 levels.
This kind of tight consolidation often signals indecision. The market is no longer in a strong downtrend phase, but it has not yet transitioned into a confirmed recovery either. Recent analyses similarly highlight this range behavior, with ETH frequently holding near the $2,000 - $2,400 zone during accumulation phases.
The Pattern Traders Keep Returning To
What stands out most is the consistency of the cycle:
- Sharp expansion phases toward $4,000 - $5,000
- Rapid breakdowns toward sub-$2,000 levels
- Repeated stabilization near key psychological zones
This repeating structure reinforces the idea that Ethereum is still operating within a broad range rather than a sustained trend. Until price breaks decisively out of this cycle - either by reclaiming higher zones or losing the current base - the volatility that has defined ETH's recent history is likely to remain the dominant feature of the market.
 Eseandre Mordi


