Eseandre Mordi

⬤ Ethereum has pulled back again after testing the same overhead resistance area, creating a clear pattern of repeated rejection on the daily timeframe. ETH is now at a critical structural moment where failing to break this zone on the next try could mean weeks or months of range-bound trading. The chart shows ETH sitting near $3,180 after another failed push above the mid-range resistance band.
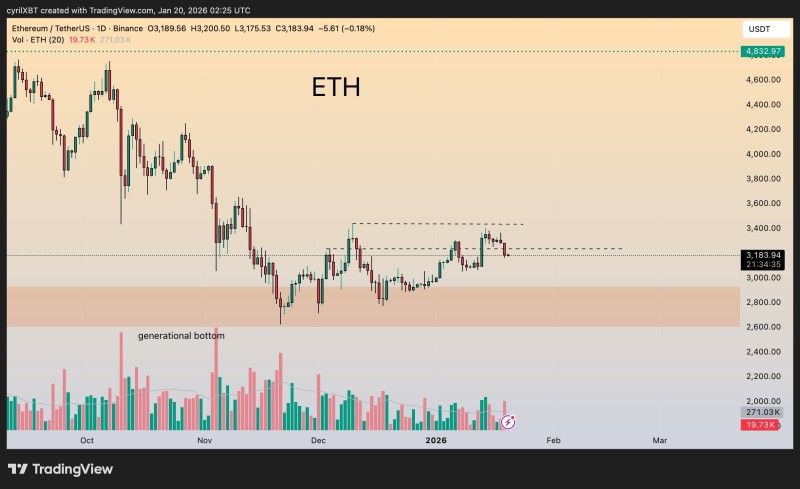
⬤ The chart shows Ethereum's recovery from the late-2025 selloff, where buyers stepped in hard around $2,600–$2,800. This zone saw heavy volume and marked a major stabilization point after the drop from above $4,000. Since then, ETH has bounced back but keeps hitting a wall below the same resistance area around $3,300–$3,400.
⬤ What's happening near this zone tells the story: momentum is fading with each approach. ETH keeps making similar highs instead of pushing higher, while volume has cooled off compared to the earlier selloff and recovery. Buyers are holding the line at lower levels, but there's not enough demand to push through resistance. Right now, ETH is stuck between upper resistance near $3,400 and lower support around $2,800–$3,000.
⬤ This matters for the broader market because prolonged consolidation usually delays trend continuation and squeezes volatility. When the same level keeps rejecting price, it becomes a major reference point going forward. If Ethereum stays locked in this range, traders might be looking at weeks or even months of sideways action before something decisive happens. How the next test of resistance plays out could shape Ethereum's direction for much of 2026.
 Eseandre Mordi