 Artem Voloskovets

Ethereum's latest pullback has spooked some short-term traders, but zoom out and the picture looks quite different. On the monthly timeframe, ETH's structure still looks solid.
What the Monthly Chart Shows
As trader Cantonese Cat noted, "nothing's changed" when you look at the bigger picture. The chart backs this up—ETH is consolidating above important Ichimoku support zones, a pattern that's often led to strong rallies in the past.
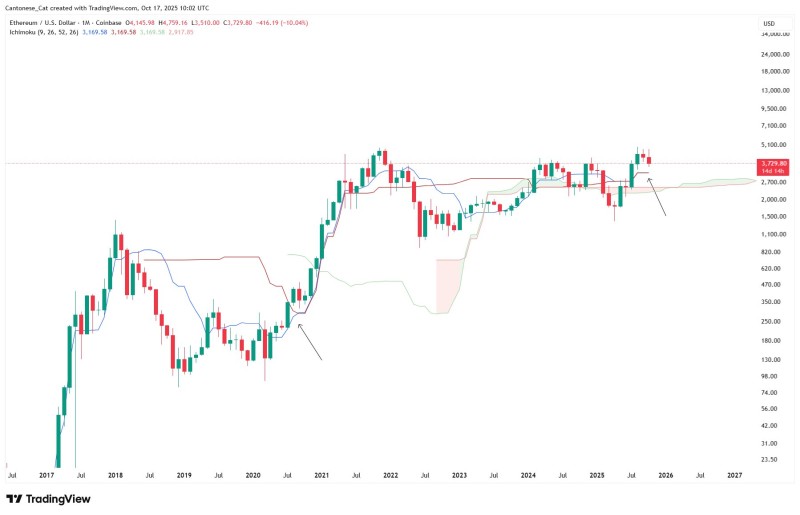
Long-term trend staying strong. Ethereum has been making higher lows since bottoming out in 2022, showing the bull structure is still alive. The $2,700 level, which lines up with the Ichimoku cloud, has held up as solid support multiple times. Recent dips bounced right off this zone, proving it matters.
Resistance getting tested. ETH pushed up to $4,100 before sellers knocked it back toward $3,700. But here's the thing—price is still sitting above the cloud, which is technically bullish. The Ichimoku cloud position suggests buyers still have the upper hand, even when the price pulls back temporarily.
History might be repeating. Back in 2019–2020, Ethereum went through similar sideways action before exploding past $4,000. We could be seeing that setup play out again.
Why ETH Still Looks Bullish
The fundamentals are hard to ignore. Ethereum powers most of DeFi, NFTs, and Layer 2 solutions—that's real, ongoing demand. Institutional money keeps flowing in through ETFs, and staking is pulling more coins off the market. Plus, with central banks easing up globally, risk assets like ETH typically catch a bid when liquidity increases.
 Artem Voloskovets


