Eseandre Mordi

⬤ Ethereum is heading toward a critical zone marked by heavy liquidation activity between $2,950 and $3,050. Recent liquidation maps show both long and short positions clustered tightly in this range, with ETH currently trading near $3,120. Data from major exchanges reveals concentrated pockets of leverage stacked around this band, setting the stage for a potentially sharp move in either direction.
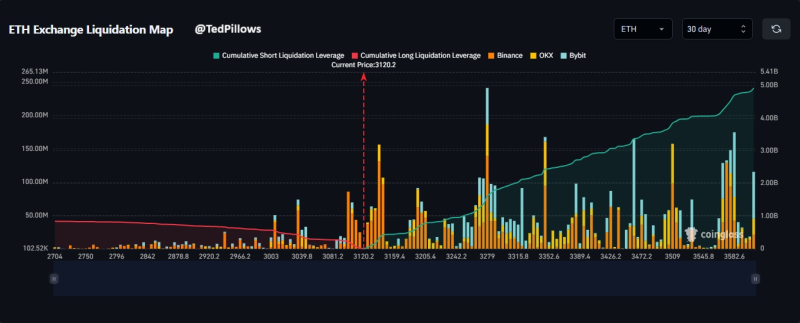
⬤ The bigger story is what's sitting above current prices. Liquidation maps show substantially more short positions piled up beyond $3,200 and throughout the mid-$3,000s. This means any rally could trigger way more forced liquidations than a drop into the lower cluster. Heavy positioning on Binance, OKX, and Bybit above spot price suggests a breakout would likely spark cascading buy orders that amplify the move.
⬤ The $3,000 level is the nearest test for ETH right now. Long liquidations are lighter heading into this zone compared to the dense wall of shorts sitting overhead. This asymmetry creates a setup where downside movement might cause brief chop, but the real fireworks would likely come if price pushes into those bigger liquidity pools above.
⬤ These liquidation clusters matter because they tend to pull price toward them when leverage gets high. When big liquidity bands stack up just above or below the market, momentum typically picks up fast once one side starts unwinding. With Ethereum closing in on its nearest cluster and far more leverage positioned overhead, expect sharper swings as the market works through these pockets over the coming days.
 Eseandre Mordi