 Saad Ullah

⬤ Ethereum has slipped into a significant support region after several weeks of relentless downside pressure. ETHUSD is now trading inside a potential reversal zone where price has historically triggered increased buying interest. The latest 4-hour and 1-hour charts are being watched closely as the market looks for signs of stabilization following the drop toward the $2,600 to $2,750 range.
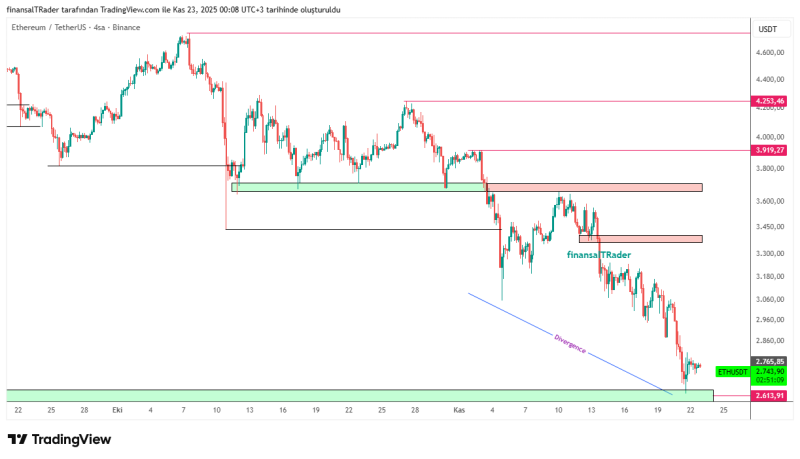
⬤ Recent charts show that Ethereum has been steadily declining from the $3,900 area, breaking through multiple support zones and forming a clear lower-high and lower-low pattern. The updated 4-hour chart highlights bullish divergence developing between price and momentum indicators, suggesting selling pressure might be weakening. Key technical levels include upper resistance near $3,919, mid-range resistance around $3,450, and the highlighted support block extending toward roughly $2,616. ETH is currently trading just above that zone, with intraday candles showing early signs of consolidation.
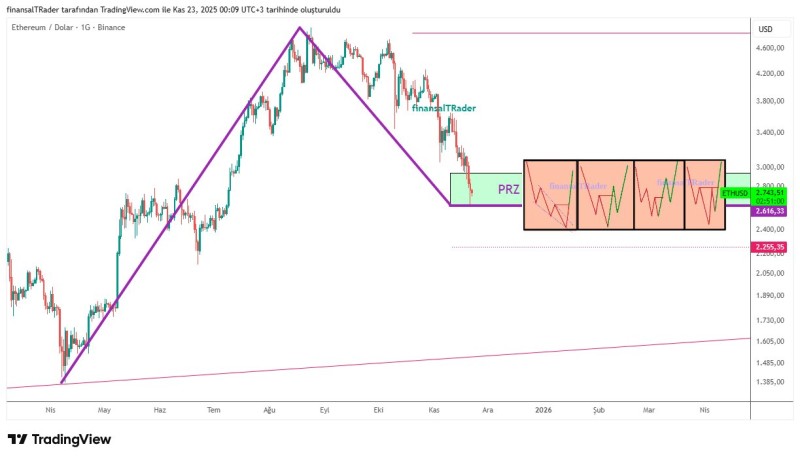
⬤ The broader daily chart emphasizes the reversal area, marked as the PRZ (Potential Reversal Zone) near $2,600. The chart shows Ethereum has retraced deeply from its July peak, moving toward an area where multiple technical factors come together. Historical reactions within similar zones have sparked short-term corrective bounces. Updated projections suggest potential range-bound behavior before any decisive upward move, with recovery targets positioned above $2,800 if short-term strength develops.
⬤ This matters because Ethereum's movement near a major support cluster could shape near-term sentiment across the broader crypto market. When ETH approaches zones that historically attract buyers, volatility typically increases and short-term trend shifts may emerge. The bullish divergence on the 4-hour timeframe strengthens the case for a temporary relief bounce.
 Saad Ullah


