 Victoria Bazir

⬤ Dogecoin (DOGE) is showing an interesting momentum shift on its 4-hour chart. While the price keeps making lower lows, the Relative Strength Index is actually climbing higher. This disconnect suggests selling pressure is starting to ease up, even though the price hasn't recovered yet. The chart clearly marks where this divergence is happening on both the candle pattern and the RSI line.
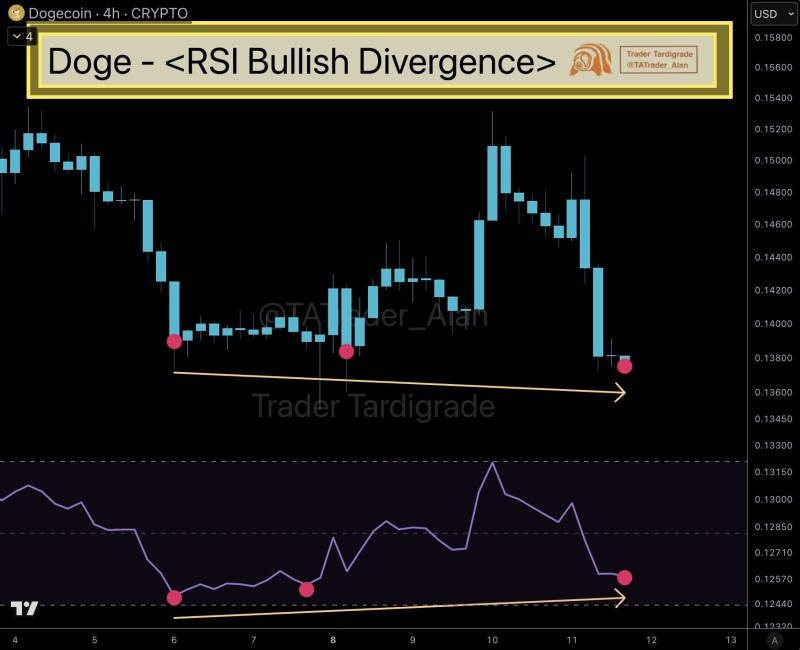
⬤ What's happening here is pretty straightforward—DOGE has been sliding downward, creating a series of lower swing lows. But here's the twist: the RSI isn't following that same pattern. Instead, it's trending upward, which tells us the downside momentum is losing steam. When you see price dropping but the indicator strengthening, that's typically a sign bearish control might be weakening.
⬤ Right now, DOGE is trading around $0.138 to $0.140, a zone where it's consolidated before. The chart doesn't spell out exact price targets, but the divergence itself shows the internal structure is getting healthier. Each new dip is producing a higher RSI low, meaning momentum is quietly improving behind the scenes. Traders watch these patterns closely because they often come before stabilization or short-term bounces when market conditions cooperate.
⬤ This setup matters because momentum shifts during downtrends can change how the market feels about a coin. If DOGE responds to this bullish divergence and the broader crypto market stays supportive, we could see a shift in short-term volatility and sentiment around Dogecoin.
 Victoria Bazir


