 Saad Ullah

After weeks of grinding lower, Dogecoin is finally showing something worth paying attention to. The memecoin's Relative Strength Index has punched through a descending resistance line on the 4-hour chart—the kind of move that often shows up right before price follows suit.
What the Charts Are Showing
Trader Trader Tardigrade points out that DOGE is now sitting at a critical spot where a clean break could actually stick this time. The 4-hour DOGE/USD chart shows a pretty textbook downward channel with parallel trendlines connecting lower highs and lows. Price recently bounced off the bottom and is now pushing up against the upper channel resistance around $0.19. That's the line in the sand right now.
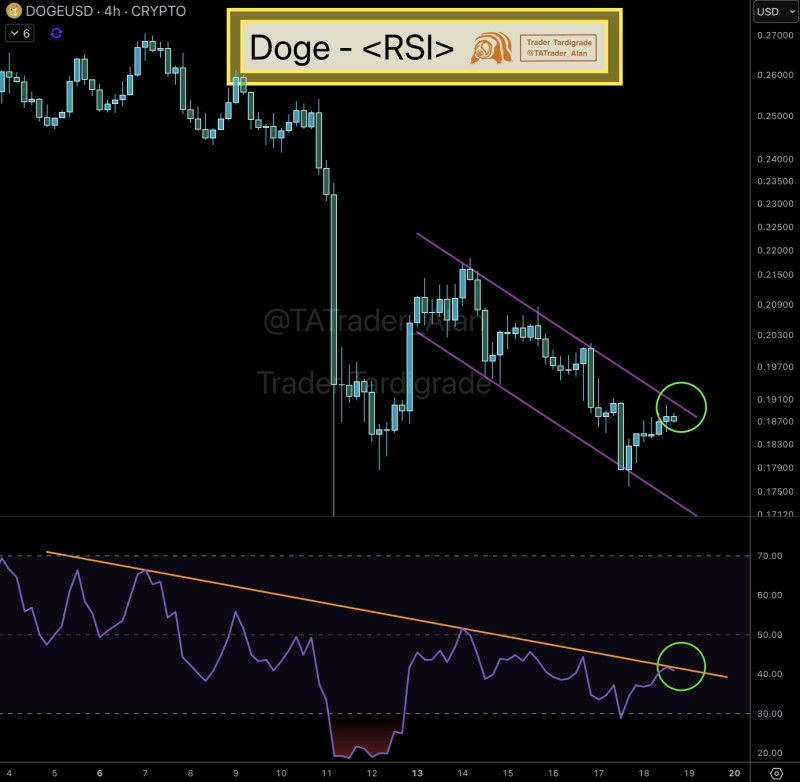
The RSI tells a more interesting story. It's broken above its own downtrend line and crossed into the 45–50 zone, which usually means the selling pressure is losing steam. When RSI starts to turn while price is still grinding, that divergence can be an early warning that things are about to shift. If DOGE clears $0.19–$0.20 with conviction, the next stops would likely be $0.205 and $0.225. But if support at $0.17 gives way, this setup falls apart pretty quickly.
The Bigger Picture
DOGE hasn't been doing much lately, but it's still one of the most-watched coins out there. The broader market's been picking up a bit—Bitcoin ETF money keeps flowing in, and some of that's rotating into altcoins. If that backdrop holds, any technical breakout in Dogecoin could get amplified, especially since volatility's been so compressed recently.
Key resistance: $0.19–$0.20 (upper channel line) Upside targets: $0.205, then $0.225 Critical support: $0.17–$0.172 RSI confirmation: Needs to hold above 50 to keep momentum alive
Dogecoin's at a turning point. The RSI breakout is encouraging, and price is testing the top of its channel. If the momentum keeps building, DOGE could finally shake off this downtrend and start pushing toward those higher resistance levels. But it's not a done deal yet—watch how it handles that $0.19–$0.20 zone.
 Saad Ullah


