 Saad Ullah

⬤ Dogecoin has reached a pivotal short-term moment as technical indicators point to weakening sell-side momentum. The 4-hour DOGE chart shows price hovering near $0.125 after a steady decline from the $0.14 level. A bullish divergence has emerged between price movement and the Relative Strength Index, signaling a shift in momentum even though price remains under pressure.
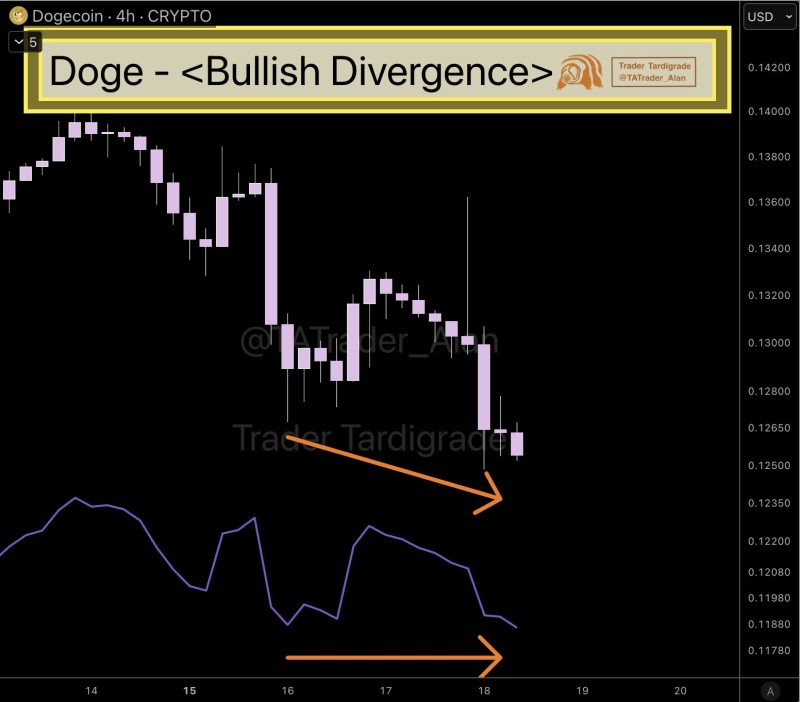
⬤ The chart shows a clear pattern of lower highs and lower lows, confirming Dogecoin's established downtrend. But here's what's interesting: while price keeps making slightly lower lows, the RSI indicator isn't following the same path anymore. Instead, RSI has been forming higher lows, creating the divergence marked by arrows on the chart. This indicates weakening downside pressure rather than a full trend reversal.
⬤ Price is currently holding steady in a tight range between roughly $0.123 and $0.126, based on recent candle closes. Volatility has dropped compared to earlier sessions—something that typically happens when aggressive selling starts to fade. The divergence hints that sellers might be losing grip in the short term, though the broader downtrend hasn't changed yet. On the 4-hour timeframe, this type of setup usually leads to consolidation or a small bounce rather than an immediate trend change.
⬤ This matters for the wider crypto market because Dogecoin remains one of the most actively traded digital assets, especially during high-speculation periods. Momentum shifts in DOGE often ripple across meme coins and other volatile cryptocurrencies. With price holding support while momentum improves, the market may be entering a transition phase where traders reconsider near-term direction in the coming days.
 Saad Ullah


