 Saad Ullah

⬤ Dogecoin just hit a major support zone on the weekly chart that's been called its "launch pad" — a trendline that's kicked off several explosive rallies in the past. DOGE is sitting right on this rising support line, the same spot where it's bounced hard multiple times over the last two years. Each time it touched this level before, it led to huge upward moves.
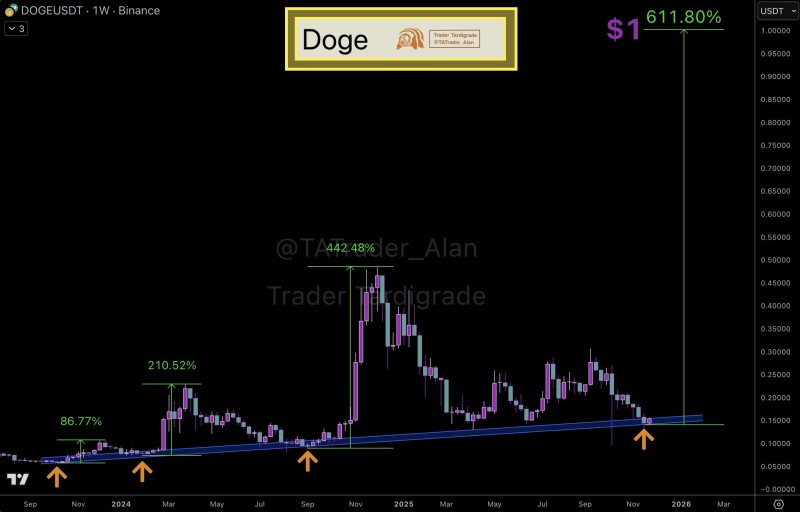
⬤ The chart shows three previous rebounds from this exact trendline. The first bounce delivered an 86.77% gain, the second pushed 210.52% higher, and the third exploded 442.48%. Each rally is marked with arrows and percentages, showing how DOGE repeatedly accelerated after testing this zone. Right now, the weekly candle is touching the same region near $0.15, lining up perfectly with those earlier launch points.
⬤ There's also a projection on the chart pointing toward $1, which would represent a 611.80% increase from current levels. While the chart doesn't guarantee direction or timing, it puts the $1 target in context with those previous percentage moves and the trendline structure. The repeated historical reactions are what's driving the "launch pad" comparison.
⬤ Long-term support structures like this often shape sentiment around volatile assets like Dogecoin. The chart highlights how DOGE has historically responded with massive swings after hitting this trendline, and its return to this area raises the question of whether another similar pattern is about to play out. As the market heads into 2026, the alignment between current price action and past behavior puts Dogecoin's technical setup back in the spotlight.
 Saad Ullah


