 Saad Ullah

Dogecoin (DOGE) traders are keeping a close eye on what could be a pivotal moment. The coin has been consolidating inside a symmetrical triangle pattern on the 4-hour chart, reflecting an ongoing battle between buyers and sellers. As price action tightens toward the apex of this formation, a sharp volatility expansion typically follows — and the market appears to be reaching that critical junction.
Technical Setup: Triangle Compression Points to Impending Breakout
According to Trader Tardigrade, a respected analyst known for precise technical work, the current structure shows two converging trendlines that have contained Dogecoin's movement since mid-October. The descending resistance line connects a series of lower highs from the $0.24 level, while the ascending support line traces higher lows originating from the $0.17 zone.
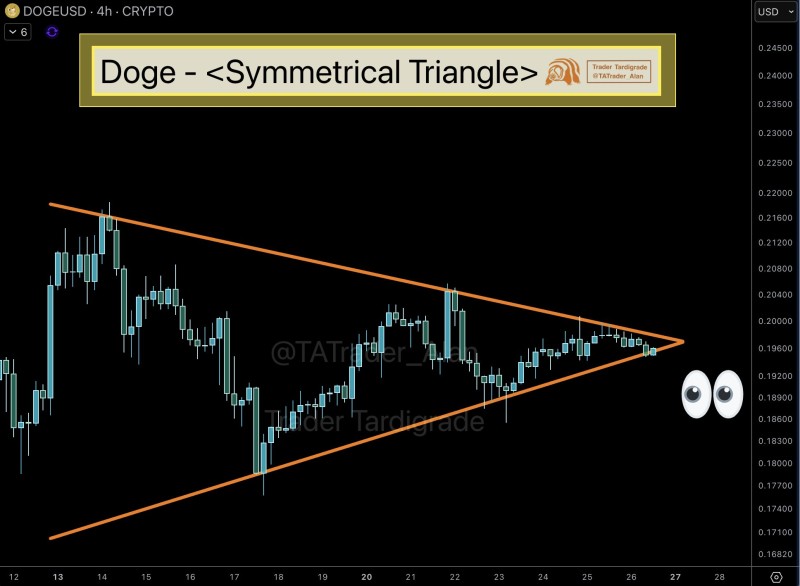
Right now, Dogecoin is trading around $0.195–$0.197, positioned right at the triangle's tip. This represents maximum price compression — a point where indecision usually resolves quickly in one direction. The pattern already displays shrinking candle bodies and smaller wicks, classic signs that momentum is fading before a larger directional move emerges.
That said, no confirmed breakout has occurred yet. Bulls would want to see a sustained close above $0.205–$0.21, which could clear the path toward the $0.23–$0.24 resistance zone. On the flip side, if support at $0.185–$0.18 fails to hold, bears would take control and likely push price down toward $0.17.
Market Context and Sentiment
Dogecoin's sideways grind comes during a broader quiet period across the crypto market. While Bitcoin holds steady above $65,000, most altcoins including DOGE remain stuck in consolidation ranges. Even so, Dogecoin continues to enjoy strong community backing, which tends to amplify moves once volatility picks up again. Historically, triangle formations on DOGE have preceded significant rallies or sharp corrections, depending on which way the breakout unfolds.
Trading Outlook
The compression phase "suggests an upcoming volatility spike," according to the analyst. Symmetrical triangles are neutral by nature — the next impulse depends entirely on volume confirmation and broader market sentiment. Key levels to watch include:
- Bullish breakout: sustained move above $0.205
- Bearish breakdown: failure to hold $0.18
Traders should wait for a decisive candle close beyond the trendlines before committing to a direction. A confirmed push above $0.205 could reignite bullish momentum, while a drop below $0.18 would signal that sellers have regained the upper hand.
 Saad Ullah


