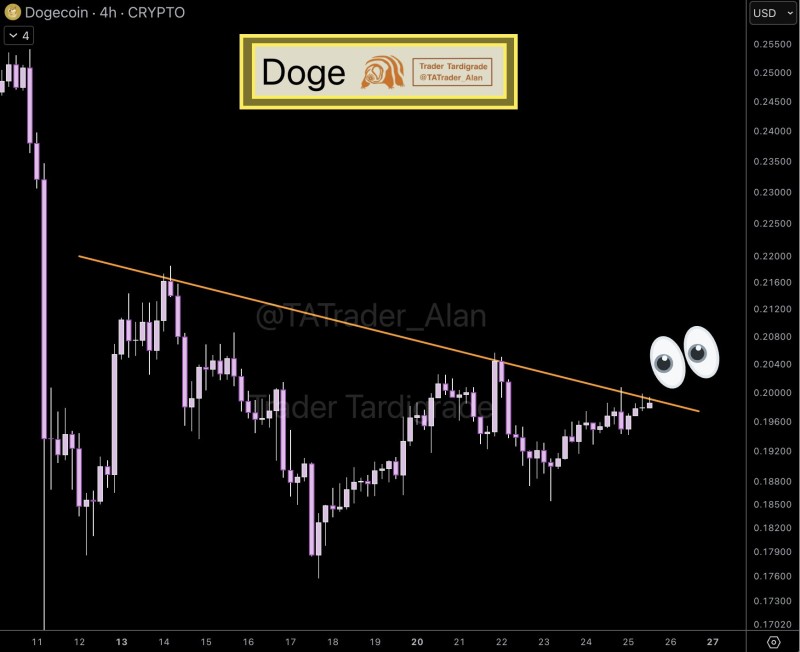
Dogecoin (DOGE) chart is catching eyes again as the meme coin approaches a crucial technical level. The price is pressing against a multi-week descending trendline that has repeatedly blocked upward moves. With DOGE now hovering just below $0.20, traders are watching closely for signs of a momentum shift that could shape its next big move.
Dogecoin Tests Multi-Week Trendline
The 4-hour chart reveals Dogecoin trading within a descending channel since mid-October. Recent analysis by Trader Tardigrade shows a series of lower highs, indicating consistent selling pressure at each resistance test. But DOGE's recent climb from $0.17 to around $0.20 marks a notable attempt to break that downtrend, hinting at renewed buyer interest.

DOGE has formed a solid base near $0.18, which held strong during previous pullbacks. The price is now squeezing tightly against the upper trendline boundary, suggesting volatility is building before the next directional move. If Dogecoin can hold above $0.20, it could target $0.22–$0.23, marking its first meaningful upside push in weeks. On the flip side, rejection here might send it back toward $0.18 support where buyers have shown up before.
Technical Context and Market Drivers
The setup leans neutral-to-bullish in the near term. Dogecoin's recovery from recent lows comes as altcoin sentiment improves and meme coin liquidity picks up. The lack of heavy selling at current resistance suggests weakening bearish pressure, often a sign that a trend reversal could be brewing.
Speculative chatter around Dogecoin's potential role in X's payment system and broader crypto optimism have also helped its short-term outlook. If Bitcoin stays stable, DOGE could attract rotational capital as traders hunt for volatility in mid-cap coins.
 Alex Dudov

 Alex Dudov


