 Saad Ullah
Dogecoin (DOGE) is once again capturing market attention as it hovers near a pivotal support zone. The popular meme coin's technical patterns suggest that maintaining levels above $0.22 could trigger momentum for a fresh rally toward $0.29, keeping bullish sentiment alive despite recent market volatility.
Chart Pattern Analysis
The current chart reveals a symmetrical ascending triangle that has been forming since July. Analyst Ali, who shared this technical setup, notes that price recently tested the critical support at $0.22, which coincides with the 0.618 Fibonacci retracement level at $0.2288.
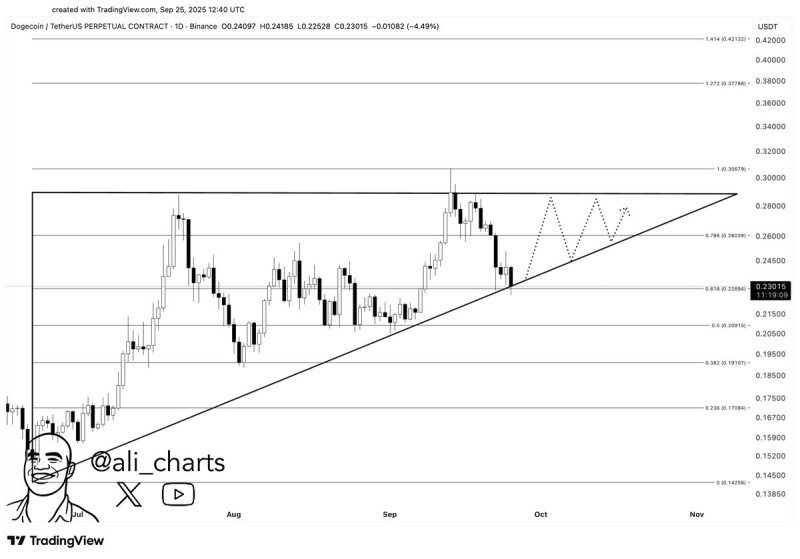
As long as Dogecoin holds this zone, traders might witness a series of higher lows gradually pushing toward the triangle's resistance near $0.29. The projection indicates potential consolidation between $0.24 and $0.29 before any significant breakout occurs. However, losing the $0.22 level would invalidate this bullish scenario, potentially opening the door to deeper retracements toward $0.20 or even $0.19.
Price Targets
- Support: $0.22 (Fibonacci 0.618, trendline support)
- Resistance: $0.29 (triangle apex, key horizontal barrier)
- Upside Targets: $0.30–$0.32, with extensions to $0.38 and $0.42 if momentum builds
Dogecoin stands at a technical crossroads where defending $0.22 could spark a new bullish wave with the next major milestone at $0.29. Conversely, failure to maintain support may shift market sentiment and trigger downside risks. Traders should closely monitor this level as the coming weeks could determine the next significant move for DOGE.
 Saad Ullah


